OPEN-SOURCE SCRIPT
Mis à jour Daily Moving Averages Oscillator
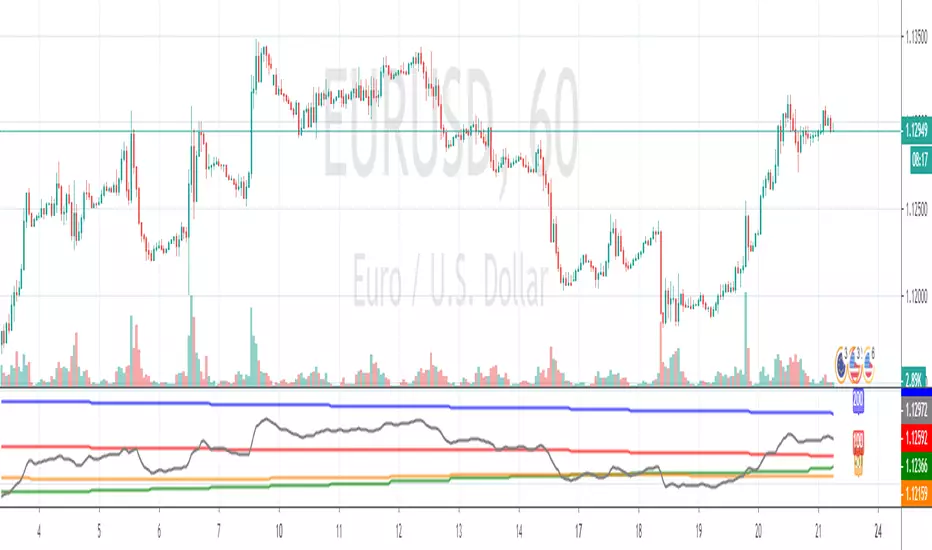
This is the best way I've found so far for gauging directional bias (i.e. overall trend) at-a-glance. It shows current price in black along with the 20, 50 & 100 daily MAs, all of which are visible at all times, and from all timeframes. No wondering where the 100MA is cause it's now showing on the chart. I also find this good for keeping my charts visually cleaner. Having the undulating lines moved underneath makes it easier for me to see support/resistance and other imporant stuff,
The trend is your friend and this helps to make sure you're on the right side of a trade.
The trend is your friend and this helps to make sure you're on the right side of a trade.
Notes de version
Fixed screenshotNotes de version
Added 200MA in blue, and 50 period Kijun (which is like a dynamic 50% fib) in brown, added some new options for hiding and offsetting the labelsScript open-source
Dans l'esprit TradingView, le créateur de ce script l'a rendu open source afin que les traders puissent examiner et vérifier ses fonctionnalités. Bravo à l'auteur! Bien que vous puissiez l'utiliser gratuitement, n'oubliez pas que la republication du code est soumise à nos Règles.
Clause de non-responsabilité
Les informations et publications ne sont pas destinées à être, et ne constituent pas, des conseils ou recommandations financiers, d'investissement, de trading ou autres fournis ou approuvés par TradingView. Pour en savoir plus, consultez les Conditions d'utilisation.
Script open-source
Dans l'esprit TradingView, le créateur de ce script l'a rendu open source afin que les traders puissent examiner et vérifier ses fonctionnalités. Bravo à l'auteur! Bien que vous puissiez l'utiliser gratuitement, n'oubliez pas que la republication du code est soumise à nos Règles.
Clause de non-responsabilité
Les informations et publications ne sont pas destinées à être, et ne constituent pas, des conseils ou recommandations financiers, d'investissement, de trading ou autres fournis ou approuvés par TradingView. Pour en savoir plus, consultez les Conditions d'utilisation.