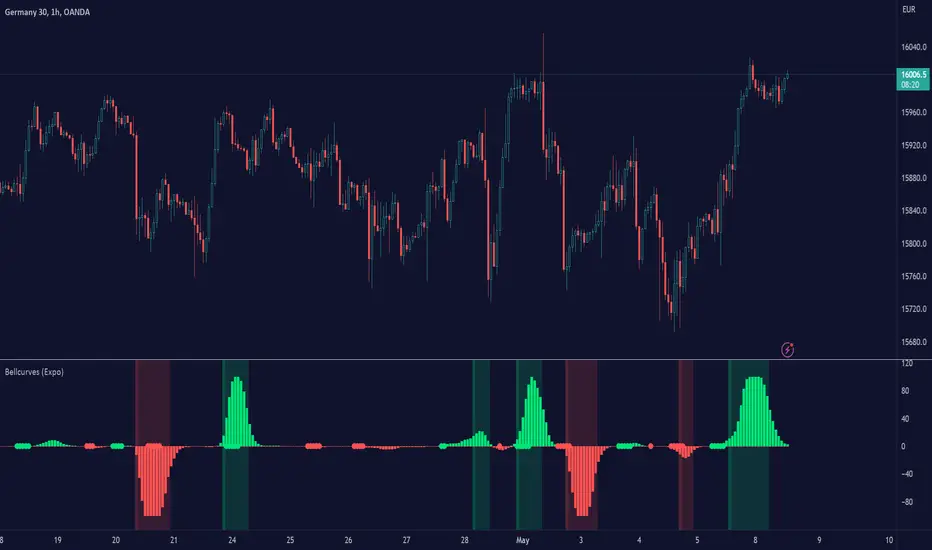
Bellcurves (Expo)

Bellcurves (Expo) indicator helps traders identify potential tops and bottoms, and gauge market impulses. It provides a clear view of the market by filtering out the noise and highlighting only the relevant information. This makes it easier for traders to identify potential market reversals and key support and resistance levels. With Bellcurves, traders can quickly and easily spot important market impulses.
█ How is Bellcurve calculated?
The Bellcurves indicator achieves this by focusing on the distribution of price data, rather than the individual price points themselves. This approach removes the noise from the data and allows traders to see the underlying price moves more clearly.
█ How to use
The unique perspective that Bellcurves offers can be especially useful in highly volatile markets. By providing a clearer view of the market impulses, Bellcurves can help traders stay ahead of market movements and take advantage of potential reversal setups.
Find Reversals
- The Bellcurves indicator shows price areas with a higher probability of a market reversal.
Take Profits
- The Bellcurves indicator can be used to identify potential exit points. For example, traders can exit their position when the Bellcurve starts to turn.
Impulses
- The height of the Bellcurve determines the strength of the price movement. The bigger the Bellcurve, the stronger the price move.
█ Additional Indicator Features
- Pre-Bellcurves: This feature highlights when a Bellcurve is about to plot.
- Oscillator mode: Traders can choose to display the Bellcurve as an oscillator.
- Momentum Impulse: Displays green and red dots when the momentum gets strong.
- Divergences: Highlights divergences between strong market impulses.
-----------------
Disclaimer
The information contained in my Scripts/Indicators/Ideas/Algos/Systems does not constitute financial advice or a solicitation to buy or sell any securities of any type. I will not accept liability for any loss or damage, including without limitation any loss of profit, which may arise directly or indirectly from the use of or reliance on such information.
All investments involve risk, and the past performance of a security, industry, sector, market, financial product, trading strategy, backtest, or individual's trading does not guarantee future results or returns. Investors are fully responsible for any investment decisions they make. Such decisions should be based solely on an evaluation of their financial circumstances, investment objectives, risk tolerance, and liquidity needs.
My Scripts/Indicators/Ideas/Algos/Systems are only for educational purposes!
- Divergence is added
Script sur invitation seulement
Seuls les utilisateurs approuvés par l'auteur peuvent accéder à ce script. Vous devrez demander et obtenir l'autorisation pour l'utiliser. Celle-ci est généralement accordée après paiement. Pour plus de détails, suivez les instructions de l'auteur ci-dessous ou contactez directement Zeiierman.
TradingView ne recommande PAS de payer ou d'utiliser un script à moins que vous ne fassiez entièrement confiance à son auteur et que vous compreniez comment il fonctionne. Vous pouvez également trouver des alternatives gratuites et open-source dans nos scripts communautaires.
Instructions de l'auteur
Join Our Free Discord: discord.gg/zeiiermantrading
Clause de non-responsabilité
Script sur invitation seulement
Seuls les utilisateurs approuvés par l'auteur peuvent accéder à ce script. Vous devrez demander et obtenir l'autorisation pour l'utiliser. Celle-ci est généralement accordée après paiement. Pour plus de détails, suivez les instructions de l'auteur ci-dessous ou contactez directement Zeiierman.
TradingView ne recommande PAS de payer ou d'utiliser un script à moins que vous ne fassiez entièrement confiance à son auteur et que vous compreniez comment il fonctionne. Vous pouvez également trouver des alternatives gratuites et open-source dans nos scripts communautaires.
Instructions de l'auteur
Join Our Free Discord: discord.gg/zeiiermantrading