PROTECTED SOURCE SCRIPT
Mis à jour CandelaCharts - Balanced Price Range (BPR)

📝 Overview
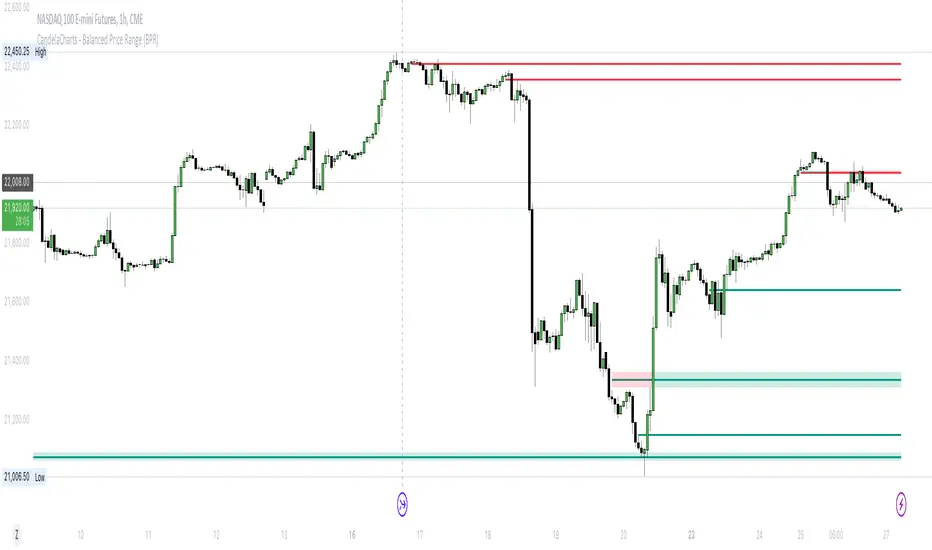
ICT Balanced Price Range (BPR) is the area on the price chart where two opposite Fair Value Gaps overlap.
To identify a Balanced Price Range (BPR), mark a fair value gap (FVG) on the sell side of the price and another on the buy side. These FVGs should be directly opposite each other horizontally. The overlapping area between the two is the Balanced Price Range.
The significance of the ICT Balanced Price Range lies in its sensitivity to price movements. When the market approaches a BPR, it often triggers a rapid and notable price reaction.
This reaction occurs because the two opposing FVGs attract the attention of smart money traders—those with substantial capital capable of influencing market trends. As a key concept in the Inner Circle Trader (ICT) methodology, the BPR serves as an ideal entry point, frequently driving considerable market activity.
📦 Features
⚙️ Settings
⚡️ Showcase
Simple

Mitigated

Bordered

Consequent Encroachment

Extended

🚨 Alerts
This script offers alert options for all signal types.
Bearish Signal
A bearish signal is generated when the price re-enters a bearish inversion zone and then reverses downward.
Bullish Signal
A bullish signal is generated when the price revisits a bullish inversion zone and then breaks upward through the top.
⚠️ Disclaimer
Trading involves significant risk, and many participants may incur losses. The content on this site is not intended as financial advice and should not be interpreted as such. Decisions to buy, sell, hold, or trade securities, commodities, or other financial instruments carry inherent risks and are best made with guidance from qualified financial professionals. Past performance is not indicative of future results.
ICT Balanced Price Range (BPR) is the area on the price chart where two opposite Fair Value Gaps overlap.
To identify a Balanced Price Range (BPR), mark a fair value gap (FVG) on the sell side of the price and another on the buy side. These FVGs should be directly opposite each other horizontally. The overlapping area between the two is the Balanced Price Range.
The significance of the ICT Balanced Price Range lies in its sensitivity to price movements. When the market approaches a BPR, it often triggers a rapid and notable price reaction.
This reaction occurs because the two opposing FVGs attract the attention of smart money traders—those with substantial capital capable of influencing market trends. As a key concept in the Inner Circle Trader (ICT) methodology, the BPR serves as an ideal entry point, frequently driving considerable market activity.
📦 Features
- MTF
- Mitigation
- Consequent Encroachment (CE)
- Threshold
- Hide Overlap
- Advanced Styling
⚙️ Settings
- Show: Controls whether BPRs are displayed on the chart.
- Show Last: Sets the number of BPRs you want to display.
- Length: Determines the length of each BPR.
- Mitigation: Highlights when an BPR has been touched, using a different color without marking it as invalid.
- Timeframe: Specifies the timeframe used to detect BPRs.
- Threshold: Sets the minimum gap size required for BPR detection on the chart.
- Show Mid-Line: Configures the midpoint line's width and style within the BPR. (Consequent Encroachment - CE)
- Show Border: Defines the border width and line style of the BPR.
- Hide Overlap: Removes overlapping BPRs from view.
- Extend: Extends the BPR length to the current candle.
- Elongate: Fully extends the BPR length to the right side of the chart.
⚡️ Showcase
Simple
Mitigated
Bordered
Consequent Encroachment
Extended
🚨 Alerts
This script offers alert options for all signal types.
Bearish Signal
A bearish signal is generated when the price re-enters a bearish inversion zone and then reverses downward.
Bullish Signal
A bullish signal is generated when the price revisits a bullish inversion zone and then breaks upward through the top.
⚠️ Disclaimer
Trading involves significant risk, and many participants may incur losses. The content on this site is not intended as financial advice and should not be interpreted as such. Decisions to buy, sell, hold, or trade securities, commodities, or other financial instruments carry inherent risks and are best made with guidance from qualified financial professionals. Past performance is not indicative of future results.
Notes de version
CandelaCharts - Balanced Price Range (BPR) 1.0.1- Fix alerts bug
Notes de version
CandelaCharts - Balanced Price Range (BPR) 1.0.2- Add filtering by bias
Script protégé
Ce script est publié en source fermée. Cependant, vous pouvez l'utiliser librement et sans aucune restriction – pour en savoir plus, cliquez ici.
Get access to our exclusive tools: candelacharts.com
Join our community: discord.gg/etGSTepqbu
All content provided by CandelaCharts is for informational & educational purposes only.
Join our community: discord.gg/etGSTepqbu
All content provided by CandelaCharts is for informational & educational purposes only.
Clause de non-responsabilité
Les informations et publications ne sont pas destinées à être, et ne constituent pas, des conseils ou recommandations financiers, d'investissement, de trading ou autres fournis ou approuvés par TradingView. Pour en savoir plus, consultez les Conditions d'utilisation.