Mis à jour
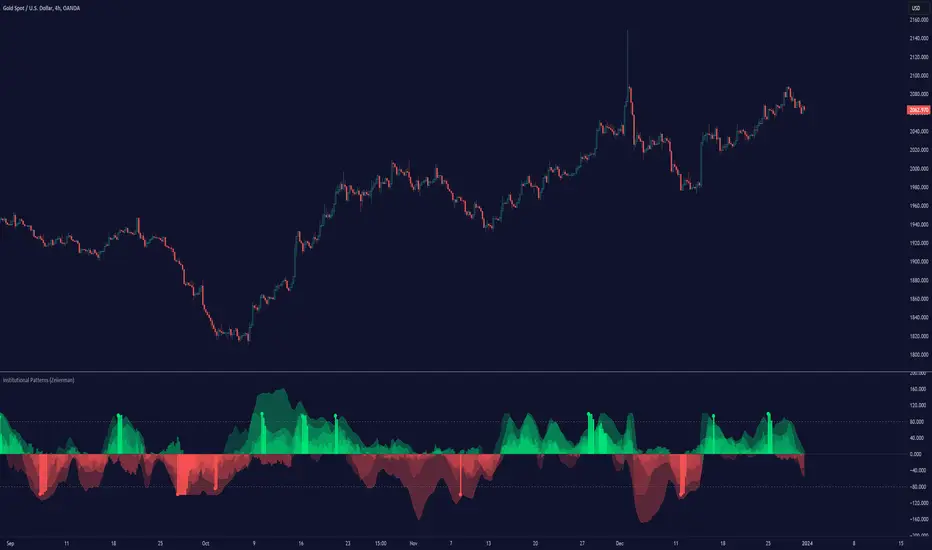
Institutional Patterns (Zeiierman)
█ Overview
Institutional Patterns (Zeiierman) reveals how large participants quietly shape market structure. It transforms price, volume, and momentum into a unified view of institutional activity, helping traders see beyond surface volatility to understand where meaningful capital is entering or exiting the market.
The indicator operates through two primary layers:
Pre-Institutional Activity, which highlights early accumulation or distribution before trends emerge, and Institutional Activity, which visualizes active participation once those trends are underway. Each layer combines flow signals from momentum, trend, and volume domains into an adaptive map of market behavior. The result is a fluid representation of how professional money interacts with price, showing when participation is strengthening, fading, or shifting direction.

⚪ Why This One Is Unique
Traditional “smart money” indicators focus on one aspect of market behavior. Institutional Patterns blends multiple adaptive models into a single, self-adjusting framework that evaluates participation strength and direction dynamically.
Its internal flow engine rebalances several momentum and volume dimensions based on changing volatility and structure. This allows it to remain stable in trending environments while still sensitive to early signs of accumulation or exhaustion. Traders gain a clear sense of whether the underlying flow supports or contradicts visible price action.
█ Main Features
⚪ Smart Money Flow
Smart Money Flow provides a multi-dimensional view of how institutional participation evolves beneath price action. It combines several adaptive models that represent different aspects of market behavior—momentum, volatility balance, trend inertia, and volume displacement—into a single synchronized flow structure.
When the flows move together, it shows unified institutional behavior; when they diverge, it signals redistribution, exhaustion, or hidden accumulation. The flow visualization reacts dynamically to volatility shifts, helping traders detect the strength or fragility behind visible price trends.

⚪ Institutional Activity Layer
The Institutional Activity Layer transforms the collective signals of Smart Money Flow into a coherent measure of institutional intent. It visualizes where capital is entering or exiting positions in real time.
Each activity pulse represents the depth of institutional engagement, filtered through adaptive volatility scaling. Green regions highlight expansion phases when capital is building into strength, while red regions indicate contraction or controlled distribution.
This layer bridges the gap between short-term trader behavior and long-term professional positioning, providing a clear and adaptable view of where meaningful market participation truly resides.

⚪ Key Terms
Accumulation vs. Distribution
These terms describe what large participants are doing, not necessarily whether price is going up or down at that moment:
█ How to Use
⚪ Trend Following
The simplest way to use the indicator is to look for alignment across the Smart Money Flow components.
When most of the flows align in green, it signals strong buying pressure and confirms that institutional participation supports the uptrend. This is the ideal environment for trend-following trades in the direction of strength.
When most flows align in red, it indicates dominant selling pressure and active distribution, suggesting short opportunities aligned with the prevailing downtrend.

⚪ Pullbacks
Pullbacks can be identified when the Leading Flow begins to diverge from the primary Smart Money Flow.
If the main flow remains bullish (green) but the leading flow temporarily turns bearish (red), it often marks a short-term retracement within an uptrend. This phase can offer re-entry opportunities for long positions once the flows realign.

In a downtrend, the opposite applies. If the main flow remains bearish (red) and the leading flow turns bullish (green), it signals a temporary countertrend bounce that may provide short re-entry points after the correction fades.

⚪ Breakouts
Breakouts are best confirmed by the Institutional Activity Layer.
A bullish breakout occurs when institutional activity spikes above a breakout level with clear green intensity, confirming active capital expansion and strong follow-through potential.

Conversely, a bearish breakout is confirmed when institutional activity rises below a breakdown level with strong red intensity, signaling renewed distribution and a potential continuation of the downtrend.

⚪ Reversals
Institutional activity can also reveal potential reversal zones.
Note: These signals can be the first sign of a potential reversal, but they still need confirmation before taking action.

⚪ Squeeze Detections
Squeeze conditions occur when volume flow begins to diverge from the primary trend, showing early signs of trapped positioning.
If volume flow turns bullish while price and trend flow remain bearish, it suggests buyers are stepping in early. If the price then accelerates downward, longs get trapped and start closing positions, triggering a long liquidation that further fuels the drop.

If volume flow turns bearish while price and trend flow remain bullish, it signals early selling pressure. If the price then pushes higher, shorts begin exiting to limit losses, causing a short squeeze that amplifies the upward move.

█ How It Works
⚪ Flow Integration Framework
The indicator combines several flow components into a single activity field using advanced normalization and smoothing logic. Each flow—trend, momentum, oscillator, and volume bias—contributes a weighted directional influence. These are blended into a balanced structure that represents the strength and direction of institutional behavior across time.
⚪ Institutional Activity Core
At the core of the system is a volatility-adaptive activity model that interprets both price displacement and volume footprint asymmetry. It measures how trade flow diverges from recent equilibrium and translates that divergence into a refined intensity signal. The model reacts dynamically to imbalances between buying and selling pressure (delta), revealing whether institutional flow is accumulating into strength or distributing into weakness.
⚪ Pre-Institutional Detection Engine
The early detection engine isolates latent footprint formations and delta transitions that occur before price movement becomes visible. It examines structural variance, order-flow dispersion, and volatility compression to pinpoint areas where large participants begin to build or unwind positions.
-----------------
Disclaimer
The content provided in my scripts, indicators, ideas, algorithms, and systems is for educational and informational purposes only. It does not constitute financial advice, investment recommendations, or a solicitation to buy or sell any financial instruments. I will not accept liability for any loss or damage, including without limitation any loss of profit, which may arise directly or indirectly from the use of or reliance on such information.
All investments involve risk, and the past performance of a security, industry, sector, market, financial product, trading strategy, backtest, or individual's trading does not guarantee future results or returns. Investors are fully responsible for any investment decisions they make. Such decisions should be based solely on an evaluation of their financial circumstances, investment objectives, risk tolerance, and liquidity needs.
Institutional Patterns (Zeiierman) reveals how large participants quietly shape market structure. It transforms price, volume, and momentum into a unified view of institutional activity, helping traders see beyond surface volatility to understand where meaningful capital is entering or exiting the market.
The indicator operates through two primary layers:
Pre-Institutional Activity, which highlights early accumulation or distribution before trends emerge, and Institutional Activity, which visualizes active participation once those trends are underway. Each layer combines flow signals from momentum, trend, and volume domains into an adaptive map of market behavior. The result is a fluid representation of how professional money interacts with price, showing when participation is strengthening, fading, or shifting direction.
⚪ Why This One Is Unique
Traditional “smart money” indicators focus on one aspect of market behavior. Institutional Patterns blends multiple adaptive models into a single, self-adjusting framework that evaluates participation strength and direction dynamically.
Its internal flow engine rebalances several momentum and volume dimensions based on changing volatility and structure. This allows it to remain stable in trending environments while still sensitive to early signs of accumulation or exhaustion. Traders gain a clear sense of whether the underlying flow supports or contradicts visible price action.
█ Main Features
⚪ Smart Money Flow
Smart Money Flow provides a multi-dimensional view of how institutional participation evolves beneath price action. It combines several adaptive models that represent different aspects of market behavior—momentum, volatility balance, trend inertia, and volume displacement—into a single synchronized flow structure.
When the flows move together, it shows unified institutional behavior; when they diverge, it signals redistribution, exhaustion, or hidden accumulation. The flow visualization reacts dynamically to volatility shifts, helping traders detect the strength or fragility behind visible price trends.
⚪ Institutional Activity Layer
The Institutional Activity Layer transforms the collective signals of Smart Money Flow into a coherent measure of institutional intent. It visualizes where capital is entering or exiting positions in real time.
Each activity pulse represents the depth of institutional engagement, filtered through adaptive volatility scaling. Green regions highlight expansion phases when capital is building into strength, while red regions indicate contraction or controlled distribution.
This layer bridges the gap between short-term trader behavior and long-term professional positioning, providing a clear and adaptable view of where meaningful market participation truly resides.
⚪ Key Terms
Accumulation vs. Distribution
These terms describe what large participants are doing, not necessarily whether price is going up or down at that moment:
- Accumulation: Institutions are building long exposure—quietly buying over time, often during a sideways or suppressed market phase, before a larger uptrend.
- Distribution: Institutions are building short exposure or unloading longs—selling gradually into strength, often during or near the end of an uptrend.
In a Uptrend Context
During an uptrend, institutions often accumulate early and distribute later.
- Accumulation occurs when large players are building long positions during consolidation or pullbacks, preparing for the next upward leg.
- Distribution takes place when they begin offloading those long positions into strength, gradually selling to retail demand near or after market peaks.
In a Downtrend Context
Even in a downtrend, both processes can still occur.
- When large players are adding short positions at higher levels, this represents distribution, as they are distributing supply into the market as the price attempts to rally.
- When institutions begin covering shorts or quietly building new long exposure for a future recovery, that marks accumulation, reflecting strategic buying while price remains weak and undervalued.
█ How to Use
⚪ Trend Following
The simplest way to use the indicator is to look for alignment across the Smart Money Flow components.
When most of the flows align in green, it signals strong buying pressure and confirms that institutional participation supports the uptrend. This is the ideal environment for trend-following trades in the direction of strength.
When most flows align in red, it indicates dominant selling pressure and active distribution, suggesting short opportunities aligned with the prevailing downtrend.
⚪ Pullbacks
Pullbacks can be identified when the Leading Flow begins to diverge from the primary Smart Money Flow.
If the main flow remains bullish (green) but the leading flow temporarily turns bearish (red), it often marks a short-term retracement within an uptrend. This phase can offer re-entry opportunities for long positions once the flows realign.
In a downtrend, the opposite applies. If the main flow remains bearish (red) and the leading flow turns bullish (green), it signals a temporary countertrend bounce that may provide short re-entry points after the correction fades.
⚪ Breakouts
Breakouts are best confirmed by the Institutional Activity Layer.
A bullish breakout occurs when institutional activity spikes above a breakout level with clear green intensity, confirming active capital expansion and strong follow-through potential.
Conversely, a bearish breakout is confirmed when institutional activity rises below a breakdown level with strong red intensity, signaling renewed distribution and a potential continuation of the downtrend.
⚪ Reversals
Institutional activity can also reveal potential reversal zones.
- If red or pink activity appears after an extended downtrend or near a lower trading range, it may indicate accumulation and an upcoming bullish reversal.
- If green or aqua activity forms after a prolonged uptrend or near upper resistance levels, it may signal distribution and the beginning of a bearish reversal.
Note: These signals can be the first sign of a potential reversal, but they still need confirmation before taking action.
⚪ Squeeze Detections
Squeeze conditions occur when volume flow begins to diverge from the primary trend, showing early signs of trapped positioning.
If volume flow turns bullish while price and trend flow remain bearish, it suggests buyers are stepping in early. If the price then accelerates downward, longs get trapped and start closing positions, triggering a long liquidation that further fuels the drop.
If volume flow turns bearish while price and trend flow remain bullish, it signals early selling pressure. If the price then pushes higher, shorts begin exiting to limit losses, causing a short squeeze that amplifies the upward move.
█ How It Works
⚪ Flow Integration Framework
The indicator combines several flow components into a single activity field using advanced normalization and smoothing logic. Each flow—trend, momentum, oscillator, and volume bias—contributes a weighted directional influence. These are blended into a balanced structure that represents the strength and direction of institutional behavior across time.
- Calculation: Employs multi-domain normalization and weighted signal blending to synchronize phase, reduce noise, and maintain a coherent directional bias across all flow sources.
⚪ Institutional Activity Core
At the core of the system is a volatility-adaptive activity model that interprets both price displacement and volume footprint asymmetry. It measures how trade flow diverges from recent equilibrium and translates that divergence into a refined intensity signal. The model reacts dynamically to imbalances between buying and selling pressure (delta), revealing whether institutional flow is accumulating into strength or distributing into weakness.
- Calculation: Utilizes a dynamic volatility envelope combined with delta-weighted response mapping to translate footprint imbalances into a smooth, self-adjusting participation curve.
⚪ Pre-Institutional Detection Engine
The early detection engine isolates latent footprint formations and delta transitions that occur before price movement becomes visible. It examines structural variance, order-flow dispersion, and volatility compression to pinpoint areas where large participants begin to build or unwind positions.
- Calculation: Applies entropy-weighted variance mapping and flow compression analysis to reveal pre-breakout regions of capital absorption or release.
-----------------
Disclaimer
The content provided in my scripts, indicators, ideas, algorithms, and systems is for educational and informational purposes only. It does not constitute financial advice, investment recommendations, or a solicitation to buy or sell any financial instruments. I will not accept liability for any loss or damage, including without limitation any loss of profit, which may arise directly or indirectly from the use of or reliance on such information.
All investments involve risk, and the past performance of a security, industry, sector, market, financial product, trading strategy, backtest, or individual's trading does not guarantee future results or returns. Investors are fully responsible for any investment decisions they make. Such decisions should be based solely on an evaluation of their financial circumstances, investment objectives, risk tolerance, and liquidity needs.
Notes de version
Major Improvements- Leading, Continuous, Momentum Trend, and Volume Smart Money Flow added.
Notes de version
Minor UpdateDisponible dans l'espace payant
Cet indicateur est uniquement disponible pour les abonnés Zeiierman . Inscrivez-vous pour accéder à ce script et à d'autres scripts de Zeiierman.
Access my indicators at: zeiierman.com
Join Our Free Discord: discord.gg/zeiiermantrading
Join Our Free Discord: discord.gg/zeiiermantrading
Clause de non-responsabilité
Les informations et publications ne sont pas destinées à être, et ne constituent pas, des conseils ou recommandations financiers, d'investissement, de trading ou autres fournis ou approuvés par TradingView. Pour en savoir plus, consultez les Conditions d'utilisation.
Disponible dans l'espace payant
Cet indicateur est uniquement disponible pour les abonnés Zeiierman . Inscrivez-vous pour accéder à ce script et à d'autres scripts de Zeiierman.
Access my indicators at: zeiierman.com
Join Our Free Discord: discord.gg/zeiiermantrading
Join Our Free Discord: discord.gg/zeiiermantrading
Clause de non-responsabilité
Les informations et publications ne sont pas destinées à être, et ne constituent pas, des conseils ou recommandations financiers, d'investissement, de trading ou autres fournis ou approuvés par TradingView. Pour en savoir plus, consultez les Conditions d'utilisation.