INVITE-ONLY SCRIPT
LevelUp^ Alpha
Mis à jour
LevelUp Alpha is a collection of tools designed in collaboration with Brian Shannon, CMT, creator of the anchored VWAP (AVWAP) and the author of two best-selling books on technical analysis. This indicator is focused on tools and techniques that Brian uses in both his analysis and trading.
LevelUp Alpha Goals
One primary goal of LevelUp Alpha was to create an indicator with tools and visuals that mimic Brian's preferred chart layouts. For example, the default lengths/colors for AVWAP, 5-day moving average and vertical lines where moving averages begin, are all aligned with Brian's approach to technical analysis. Through this educational process, one can learn how to effectively use AVWAP and other intraday tools to properly manage trades and adhere to sound risk management principles. At any point, the indicator can be customized to match one's preferred layout, colors and trading style.
Trend Alignment - Multiple Timeframe Analysis
As trend followers, we look for stocks in an established uptrend. This starts with reviewing stocks on weekly and/or daily charts. From there, we focus on lower timeframes using intraday charts, with the objective to verify alignment between the timeframes.
Important Note: The majority of tools in LevelUp Alpha are for lower timeframes (intraday) analysis as this is where potential trade setups, entries and exits (stops) are often determined.
Key Features:
▪ AVWAP auto-anchored on 1-day, 2-day, week-to-date and month-to-date (for intraday charts).
▪ AVWAP works with any exchange around the globe, respecting trading days, hours and holidays.
▪ AVWAP works with the TradingView Replay feature, facilitating historical and post-mortem analysis.
▪ 5-day moving average auto-calculated based on the chart timeframe.
▪ 5-day moving average auto-adjusts the minutes in the trading day for crypto and futures.
▪ View up to three daily moving averages on intraday charts, including optional price data.
▪ Anticipate moving average direction based on vertical lines placed at the first bar for each moving average.
▪ Pivot points, aka floor trader pivots or support/resistance levels (R1/S1, R2/S2, etc).
▪ Highlight current and prior day highs/lows with line and price data as these are areas of potential support and resistance.
▪ Table of stats for AVWAP, current and prior day highs/lows, and pivot point price levels, helpful for entries, exits and stops.
▪ Custom alerts for all AVWAPs and pivot points.
AVWAP
The Volume Weighted Average Price (VWAP) is the cumulative average price a stock traded for one day. AVWAP is the same as the VWAP with the exception that the start point (the anchor) is configurable based on a trader's preference, not simply the start of the trading day. From the anchor point forward, on each bar, AVWAP is calculated based on the cumulative volume and average price.
The AVWAP shows the relationship between price and volume over any time period based on the anchor point. At a glance we can see who is in control, the buyers (bulls) or the sellers (bears).
AVWAP Concepts:
▪ When a stock is above an advancing AVWAP, buyers are in control for that timeframe, as the average price is increasing.
▪ When prices are below a declining AVWAP, sellers are in control for that timeframe, as the average price is declining.
▪ When prices oscillate above and below the AVWAP it indicates indecision for that timeframe.
What's unique about AVWAP in this indicator is that it is auto-anchored on 1-day, 2-day, week-to-date and month-to-date. In addition, LevelUp Alpha supports any exchange around the globe, respecting trading days, hours and holidays. You can also use the TradingView replay feature with this indicator, a powerful tool for historical and post-mortem analysis.
AVWAP Auto-Anchor: 1-day, 2-day, week-to-date and month-to-date

AVWAP and TradingView Replay: Review Historical Data and Past Trades

Saudi Exchange (Tadāwul): Trading Days, Sunday to Thursday, 10:00am to 3:00pm
Auto-Anchor: Detects Trading Days

London Stock Exchange (LSE): Trading Days, Monday to Friday, 8:00am to 4:30pm
Auto-Anchor: Detects U.K. Bank Holiday

5-Day Moving Average
When using AVWAP, we look for stocks where the trend of the 50-SMA is higher. We follow this by reviewing lower timeframes (intraday charts) to see if the price action is setting up for a low risk trade by verifying the shorter timeframes align with the longer. As we look at various timeframes, we need to make sure the moving average is consistent across the timeframes, which is done via the 5-day moving average as explained by Brian:
"If you want to see a five DAY moving average on a chart with 10 minute candles, you have to consider how many 10 minute periods of trading there are in the trading day. The US equities markets are open from 9:30- 4:00 each day, which is 6.5 hours per trading day. In each hour of trading, there are 6-10 minute periods, so during the regular session for equities, the market is open for 390 minutes or 39-10 minute periods per day. If we are to get a five day moving average, we would take the 39-10 minute periods the market is open each day and then multiply that by five days. 39 x 5 = 195. So a 5 DAY moving average is represented by a 195 PERIOD moving average when looking at a 10 minute timeframe."
In LevelUp Alpha, the default value for the minutes per day is 390, the number of minutes in one trading day in the U.S. This value can be changed to match any exchange. For example, if trading the India National Stock Exchange (NSE), which is open from 9:30am to 3:30pm, the minutes per day would be set to 375.
As trend followers, our goal is to find stocks where the 5-day moving average is trending up.
5-Day Moving Average Trending Up

When viewing charts of crypto or futures, the minutes per trading day will be auto-adjusted as follows:
• Crypto: 1440 minutes per day based on 24 hrs per day.
• Futures: 1380 minutes per day based on 23 hrs per day - S&P 500 E-mini Futures (ES1!) & NASDAQ 100 E-mini Futures (NS1!)
Important Note: Based on the math as described above using the minutes in the trading day, there will be chart timeframes where the 5-day moving average is not shown. If you have the 5-day moving average enabled from within the indicator Settings, yet the 5-day line is not visible, try changing to another timeframe.
Moving Averages
There are three configurable daily moving averages, including the option to use simple or exponential calculations. These daily moving averages can be viewed on intraday charts as they can often act as areas of support or resistance. There is also an option to smooth the daily moving average when they are shown on an intraday chart.
Daily 10-SMA on Intraday Chart - Acting as Support
Auto-smoothing feature is off.

Daily 20-SMA on Intraday Chart - Acting as Support
Auto-smoothing feature is on.

Vertical Lines - Anticipating Direction
By placing vertical lines at the starting bar where a moving average calculation begins, one can anticipate the direction of the moving average by viewing the trend of the bars that will fall off the moving average as new bars are added. This can be helpful to gauge if the trend will continue in its current trajectory or begin to move in a different direction.
Intraday Chart

Daily Chart

S&P 500 E-mini Futures (ES1!)

Crypto

Pivot Points
Pivot points are intraday price levels that may act as areas of support or resistance. These pivot points were initially created by floor traders operating within the trading pits of the equity futures exchange in Chicago.
The calculations for determining these pivots are based on the prior days high, low and close:
Pivot (P) = (prevHigh + prevLow + prevClose) / 3
Resistance R1 = (2 * P) - prevLow
Support S1 = (2 * P) - prevHigh
Resistance R2 = P + (prevHigh - prevLow)
Support S2 = P - (prevHigh - prevLow)
Resistance R3 = prevHigh + (2 * (pivot - prevLow))
Support S3 = prevLow - (2 * (prevHigh - pivot))
R1 Acting as Resistance

S2 Acting as Support

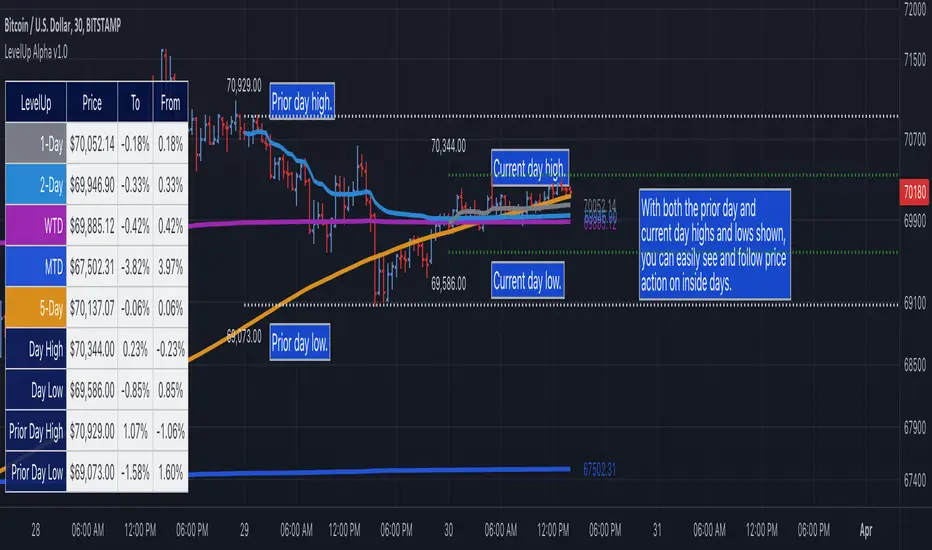
Prior Day High and Low
With LevelUp Alpha you can show horizontal lines at both the prior day high and low values. This makes it easy to visualize the prior day's trading range in anticipation of potential areas of support or resistance. These area can also be potential points for entering, exiting or profit taking.

Current Day High and Low
In a similar manner to prior day high and low values, you can also view the current day high and low. Notice in the chart below that you can easily see inside days and watch the price action in real-time.

Tables for AVWAP and Pivot Stats
To make it easy to quickly determine potential entries, exits and stops, as well as areas of support or resistance, key values can be shown in a table. The table contents are configurable, with options to include: AVWAP, current day and prior day highs/lows as well as pivot points.
AVWAP Color Coded & Pivot Points

Current Day High/Low and Prior Day High Low

Custom Alerts
There are alert options for all AVWAP values as well as resistance levels R1, R2 and support levels S1 and S2.

Acknowledgements
Many thanks to Brian Shannon for sharing his expertise on technical analysis and risk management, as well as providing feedback and suggestions on the indicator.
LevelUp Alpha Goals
One primary goal of LevelUp Alpha was to create an indicator with tools and visuals that mimic Brian's preferred chart layouts. For example, the default lengths/colors for AVWAP, 5-day moving average and vertical lines where moving averages begin, are all aligned with Brian's approach to technical analysis. Through this educational process, one can learn how to effectively use AVWAP and other intraday tools to properly manage trades and adhere to sound risk management principles. At any point, the indicator can be customized to match one's preferred layout, colors and trading style.
Trend Alignment - Multiple Timeframe Analysis
As trend followers, we look for stocks in an established uptrend. This starts with reviewing stocks on weekly and/or daily charts. From there, we focus on lower timeframes using intraday charts, with the objective to verify alignment between the timeframes.
Important Note: The majority of tools in LevelUp Alpha are for lower timeframes (intraday) analysis as this is where potential trade setups, entries and exits (stops) are often determined.
Key Features:
▪ AVWAP auto-anchored on 1-day, 2-day, week-to-date and month-to-date (for intraday charts).
▪ AVWAP works with any exchange around the globe, respecting trading days, hours and holidays.
▪ AVWAP works with the TradingView Replay feature, facilitating historical and post-mortem analysis.
▪ 5-day moving average auto-calculated based on the chart timeframe.
▪ 5-day moving average auto-adjusts the minutes in the trading day for crypto and futures.
▪ View up to three daily moving averages on intraday charts, including optional price data.
▪ Anticipate moving average direction based on vertical lines placed at the first bar for each moving average.
▪ Pivot points, aka floor trader pivots or support/resistance levels (R1/S1, R2/S2, etc).
▪ Highlight current and prior day highs/lows with line and price data as these are areas of potential support and resistance.
▪ Table of stats for AVWAP, current and prior day highs/lows, and pivot point price levels, helpful for entries, exits and stops.
▪ Custom alerts for all AVWAPs and pivot points.
AVWAP
The Volume Weighted Average Price (VWAP) is the cumulative average price a stock traded for one day. AVWAP is the same as the VWAP with the exception that the start point (the anchor) is configurable based on a trader's preference, not simply the start of the trading day. From the anchor point forward, on each bar, AVWAP is calculated based on the cumulative volume and average price.
The AVWAP shows the relationship between price and volume over any time period based on the anchor point. At a glance we can see who is in control, the buyers (bulls) or the sellers (bears).
AVWAP Concepts:
▪ When a stock is above an advancing AVWAP, buyers are in control for that timeframe, as the average price is increasing.
▪ When prices are below a declining AVWAP, sellers are in control for that timeframe, as the average price is declining.
▪ When prices oscillate above and below the AVWAP it indicates indecision for that timeframe.
What's unique about AVWAP in this indicator is that it is auto-anchored on 1-day, 2-day, week-to-date and month-to-date. In addition, LevelUp Alpha supports any exchange around the globe, respecting trading days, hours and holidays. You can also use the TradingView replay feature with this indicator, a powerful tool for historical and post-mortem analysis.
AVWAP Auto-Anchor: 1-day, 2-day, week-to-date and month-to-date
AVWAP and TradingView Replay: Review Historical Data and Past Trades
Saudi Exchange (Tadāwul): Trading Days, Sunday to Thursday, 10:00am to 3:00pm
Auto-Anchor: Detects Trading Days
London Stock Exchange (LSE): Trading Days, Monday to Friday, 8:00am to 4:30pm
Auto-Anchor: Detects U.K. Bank Holiday
5-Day Moving Average
When using AVWAP, we look for stocks where the trend of the 50-SMA is higher. We follow this by reviewing lower timeframes (intraday charts) to see if the price action is setting up for a low risk trade by verifying the shorter timeframes align with the longer. As we look at various timeframes, we need to make sure the moving average is consistent across the timeframes, which is done via the 5-day moving average as explained by Brian:
"If you want to see a five DAY moving average on a chart with 10 minute candles, you have to consider how many 10 minute periods of trading there are in the trading day. The US equities markets are open from 9:30- 4:00 each day, which is 6.5 hours per trading day. In each hour of trading, there are 6-10 minute periods, so during the regular session for equities, the market is open for 390 minutes or 39-10 minute periods per day. If we are to get a five day moving average, we would take the 39-10 minute periods the market is open each day and then multiply that by five days. 39 x 5 = 195. So a 5 DAY moving average is represented by a 195 PERIOD moving average when looking at a 10 minute timeframe."
In LevelUp Alpha, the default value for the minutes per day is 390, the number of minutes in one trading day in the U.S. This value can be changed to match any exchange. For example, if trading the India National Stock Exchange (NSE), which is open from 9:30am to 3:30pm, the minutes per day would be set to 375.
As trend followers, our goal is to find stocks where the 5-day moving average is trending up.
5-Day Moving Average Trending Up
When viewing charts of crypto or futures, the minutes per trading day will be auto-adjusted as follows:
• Crypto: 1440 minutes per day based on 24 hrs per day.
• Futures: 1380 minutes per day based on 23 hrs per day - S&P 500 E-mini Futures (ES1!) & NASDAQ 100 E-mini Futures (NS1!)
Important Note: Based on the math as described above using the minutes in the trading day, there will be chart timeframes where the 5-day moving average is not shown. If you have the 5-day moving average enabled from within the indicator Settings, yet the 5-day line is not visible, try changing to another timeframe.
Moving Averages
There are three configurable daily moving averages, including the option to use simple or exponential calculations. These daily moving averages can be viewed on intraday charts as they can often act as areas of support or resistance. There is also an option to smooth the daily moving average when they are shown on an intraday chart.
Daily 10-SMA on Intraday Chart - Acting as Support
Auto-smoothing feature is off.
Daily 20-SMA on Intraday Chart - Acting as Support
Auto-smoothing feature is on.
Vertical Lines - Anticipating Direction
By placing vertical lines at the starting bar where a moving average calculation begins, one can anticipate the direction of the moving average by viewing the trend of the bars that will fall off the moving average as new bars are added. This can be helpful to gauge if the trend will continue in its current trajectory or begin to move in a different direction.
Intraday Chart
Daily Chart
S&P 500 E-mini Futures (ES1!)
Crypto
Pivot Points
Pivot points are intraday price levels that may act as areas of support or resistance. These pivot points were initially created by floor traders operating within the trading pits of the equity futures exchange in Chicago.
The calculations for determining these pivots are based on the prior days high, low and close:
Pivot (P) = (prevHigh + prevLow + prevClose) / 3
Resistance R1 = (2 * P) - prevLow
Support S1 = (2 * P) - prevHigh
Resistance R2 = P + (prevHigh - prevLow)
Support S2 = P - (prevHigh - prevLow)
Resistance R3 = prevHigh + (2 * (pivot - prevLow))
Support S3 = prevLow - (2 * (prevHigh - pivot))
R1 Acting as Resistance
S2 Acting as Support
Prior Day High and Low
With LevelUp Alpha you can show horizontal lines at both the prior day high and low values. This makes it easy to visualize the prior day's trading range in anticipation of potential areas of support or resistance. These area can also be potential points for entering, exiting or profit taking.
Current Day High and Low
In a similar manner to prior day high and low values, you can also view the current day high and low. Notice in the chart below that you can easily see inside days and watch the price action in real-time.
Tables for AVWAP and Pivot Stats
To make it easy to quickly determine potential entries, exits and stops, as well as areas of support or resistance, key values can be shown in a table. The table contents are configurable, with options to include: AVWAP, current day and prior day highs/lows as well as pivot points.
AVWAP Color Coded & Pivot Points
Current Day High/Low and Prior Day High Low
Custom Alerts
There are alert options for all AVWAP values as well as resistance levels R1, R2 and support levels S1 and S2.
Acknowledgements
Many thanks to Brian Shannon for sharing his expertise on technical analysis and risk management, as well as providing feedback and suggestions on the indicator.
Notes de version
Version 1.1What's New:
▪ AVWAP for YTD, YTD high and YTD low for the daily timeframe.
▪ Stats table for daily the timeframe.
Notes de version
Version 1.3What's New:
▪ Add support for Average True Range (ATR) and True Range.
▪ View intraday volatility by comparing the True Range for the day versus the ATR.
Note: Version 1.2 was a minor update for the 5-day moving average. Given the limited changes, the code code was merged into this release.
Notes de version
Version 1.4What's New:
▪ Option to view pivot values Price/To/From in the stats table even if pivots points are not shown on the chart.
Notes de version
Version 1.5What's New:
▪ ATR and True Range can be shown as the only stats table data.
▪ Custom table header for ATR and True Range.
Notes de version
Version 1.6What's New:
▪ The color of the 5-day moving average can now reflect the direction of the trend.
▪ Green when trending up, red when trending down, yellow indicating areas of indecision.
Notes de version
Version 1.7What's New:
▪ Show 5-day moving average cloud, a visual representation of the trend.
▪ Configure colors and other display attributes of the clouds.
Notes de version
Version 1.7aUpdate:
▪ Fixed an issue when the 5-day moving average doesn't support the current timeframe.
Notes de version
Version 1.8What's New:
▪ Extensive customization options for prior and current day's high and low.
▪ Specify line styles and colors, as well as optional fills between highs and lows.
▪ Extend prior day line and/or fill to highlight price action.
Notes de version
Version 1.8aUpdate:
▪ Minor changes to stats table for pivot values and current day's high and low.
Notes de version
Version 1.8bUpdate:
▪ Changes to the pivot calculations to improve performance and accuracy.
Notes de version
Version 1.9What's New:
▪ When calculating the 5-day moving average, minutes in the trading day is automatically adjusted when viewing crypto or futures.
▪ Hover over the "5-Day" label in the stats table to see the current value for minutes in the trading day.
Notes de version
Version 2.0What's New:
▪ Added an option to turn on/off auto-adjusting minutes in the trading day for crypto and futures. This value is used to calculate the 5-day simple moving average.
▪ By default, the above option is enabled and crypto is set to 1440 (24 hrs * 60 mins) and futures 1380 (23 hrs * 60 mins).
Notes de version
Version 2.1What's New:
▪ Configure the color of price levels and lines above and below the pivot.
Configure Pivot Point Colors
Notes de version
Version 2.2What's New:
▪ Consolidation of features across indicators so Alpha focuses on intraday timeframes and Trend Follower on daily/weekly.
▪ Move year-to-date auto-anchored VWAP options to the Trend Follower indicator.
▪ Add two customizable intraday moving averages.
▪ Add custom alert for 5-day SMA cross.
Notes de version
Version 2.21Update:
▪ Minor change to plotting of prior day high and low.
Script sur invitation seulement
L'accès à ce script est limité aux utilisateurs autorisés par l'auteur et nécessite généralement un paiement. Vous pouvez l'ajouter à vos favoris, mais vous ne pourrez l'utiliser qu'après avoir demandé et obtenu l'autorisation de son auteur. Contactez JohnMuchow pour plus d'informations, ou suivez les instructions de l'auteur ci-dessous.
TradingView ne suggère pas de payer pour un script et de l'utiliser à moins que vous ne fassiez confiance à 100% à son auteur et que vous compreniez comment le script fonctionne. Dans de nombreux cas, vous pouvez trouver une bonne alternative open-source gratuite dans nos Scripts communautaires.
Instructions de l'auteur
″LevelUp Your Trading ~ Professional TradingView® Indicators: https://LevelUpTools.net
Vous voulez utiliser ce script sur un graphique ?
Avertissement: veuillez lire avant de demander l'accès.
LevelUp Your Trading ~ Professional TradingView® Indicators: LevelUpTools.net
Buy Me A Beer: leveluptools.gumroad.com/coffee
Thanks for your support! 🍻
Buy Me A Beer: leveluptools.gumroad.com/coffee
Thanks for your support! 🍻
Clause de non-responsabilité
Les informations et les publications ne sont pas destinées à être, et ne constituent pas, des conseils ou des recommandations en matière de finance, d'investissement, de trading ou d'autres types de conseils fournis ou approuvés par TradingView. Pour en savoir plus, consultez les Conditions d'utilisation.