PROTECTED SOURCE SCRIPT
Support & Resistance Sentinel

Support & Resistance Sentinel
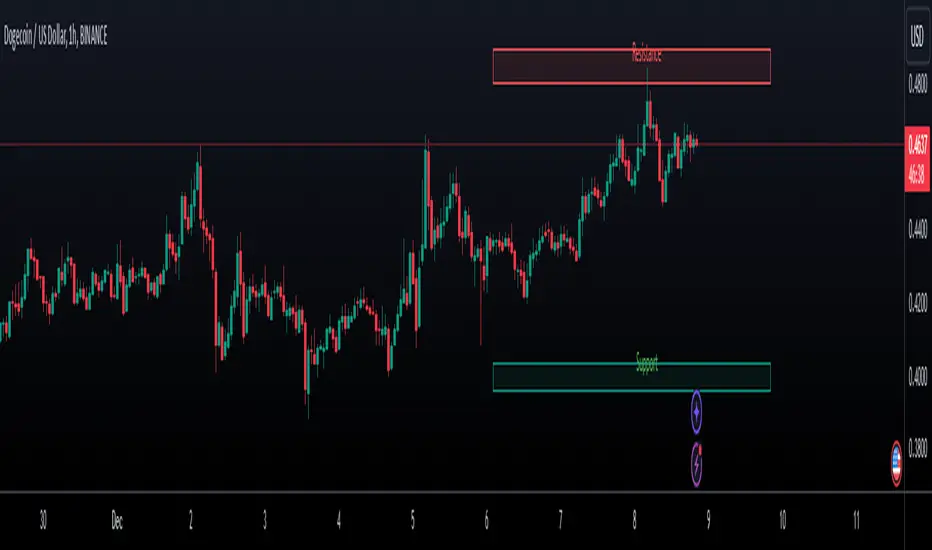
The Support & Resistance Sentinel is a powerful and versatile indicator designed to identify and visualize key support and resistance levels on your charts. By leveraging multiple technical analysis tools, it ensures accuracy and adaptability across different market conditions and timeframes.
Key Features:
Dynamic Support and Resistance Levels: The indicator dynamically identifies local highs and lows, adapting to evolving market conditions.
Volume Spike Detection: Incorporates volume analysis to highlight significant market activity, ensuring the identified levels are robust.
Moving Average and RSI Filters: Utilizes moving averages and Relative Strength Index (RSI) to validate the significance of support and resistance levels.
Higher Timeframe Confirmation: Integrates higher timeframe data to provide an additional layer of confirmation for identified levels.
Customizable Visuals: Allows users to customize the length, color, and extension of support and resistance boxes for clear and personalized chart visualization.
Alerts: Includes alert conditions to notify users when the price hits significant support or resistance levels.
How It Works:
Identification: The indicator analyzes historical price data to identify local highs and lows within a specified lookback period.
Validation: It uses moving averages and RSI to filter out less significant levels, focusing on key support and resistance zones.
Volume Analysis: Detects volume spikes to ensure the levels correspond to substantial market activity.
Higher Timeframe Integration: Combines current timeframe data with higher timeframe levels for added confirmation.
Visualization: Draws customizable boxes around the identified support and resistance levels, extending them for better visual clarity.
Alerts: Sets up alerts to notify users when the price interacts with these crucial levels.
How to Use:
Customization: Adjust input settings such as lookback period, box length, and colors to fit your trading preferences.
Observation: Monitor the chart for highlighted support and resistance zones to understand key market levels.
Trading Decisions: Use these zones to make informed trading decisions, including setting entry and exit points or stop-loss orders.
Alerts: Enable alerts to get notified when price action hits significant support or resistance levels, allowing timely decision-making.
Enhance your trading strategy with the Support & Resistance Sentinel and gain deeper insights into market dynamics..
Script protégé
Ce script est publié en source fermée. Cependant, vous pouvez l'utiliser librement et sans aucune restriction – pour en savoir plus, cliquez ici.
Clause de non-responsabilité
Les informations et publications ne sont pas destinées à être, et ne constituent pas, des conseils ou recommandations financiers, d'investissement, de trading ou autres fournis ou approuvés par TradingView. Pour en savoir plus, consultez les Conditions d'utilisation.