PROTECTED SOURCE SCRIPT
Max Price Range Deviation
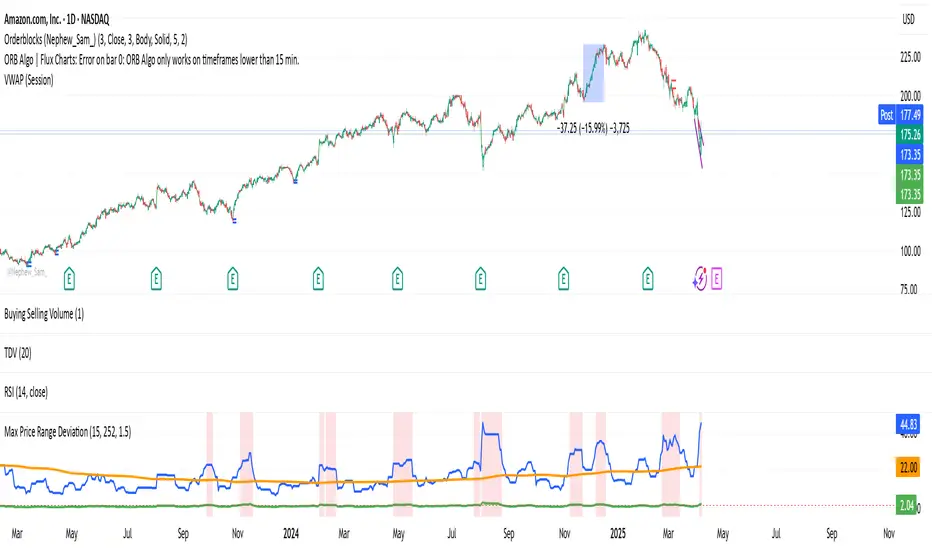
This indicator measures how far a stock has moved in recent days relative to its typical movement over a longer period.
🧠 What it does:
Calculates the absolute price range (highest high − lowest low) over a recent number of days.
Compares this recent range to the average max range from rolling windows of the same size over a longer lookback period.
Plots:
✅ Recent Range (blue line)
✅ Average Historical Range (orange line)
✅ Ratio of Recent to Average (green line)
Highlights when recent movement is significantly higher than normal using a configurable threshold.
⚙️ Inputs:
Recent Period (days): Number of days to calculate the current price move.
Lookback Period (days): Number of days used to calculate the average historical range.
High Move Threshold (x avg): If the recent move exceeds this multiple of average, it's flagged.
🛠️ Use Cases:
Spot unusually large price swings.
Identify good opportunities to sell out-of-the-money options (e.g., covered calls or credit spreads) when moves are extended.
Avoid chasing late-stage breakouts.
Script protégé
Ce script est publié en source fermée. Cependant, vous pouvez l'utiliser librement et sans aucune restriction – pour en savoir plus, cliquez ici.
Clause de non-responsabilité
Les informations et publications ne sont pas destinées à être, et ne constituent pas, des conseils ou recommandations financiers, d'investissement, de trading ou autres fournis ou approuvés par TradingView. Pour en savoir plus, consultez les Conditions d'utilisation.