OPEN-SOURCE SCRIPT
VixFix RVol + EMA
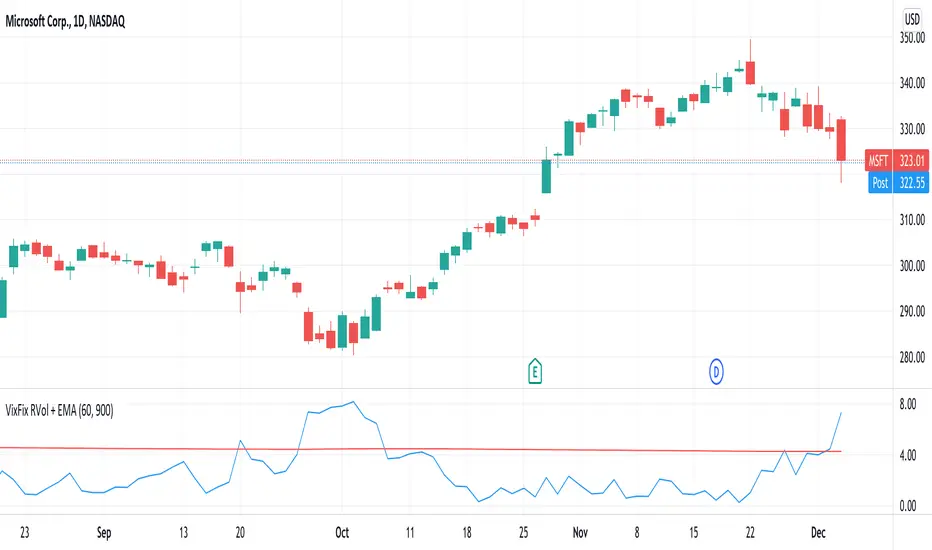
This indicator plots Realised Volatility (measured using VixFix method) against its long-term exponential moving average.
RVol breaking above its EMA = Sell signal
RVol breaking below its EMA = Buy signal
60-day VixFix look back period and 900 day EMA work well for lower volatility tickers (equity ETFs, megacap stocks). Higher volatility tickers could benefit from shorter look back period and EMA.
RVol breaking above its EMA = Sell signal
RVol breaking below its EMA = Buy signal
60-day VixFix look back period and 900 day EMA work well for lower volatility tickers (equity ETFs, megacap stocks). Higher volatility tickers could benefit from shorter look back period and EMA.
Script open-source
Dans l'esprit TradingView, le créateur de ce script l'a rendu open source afin que les traders puissent examiner et vérifier ses fonctionnalités. Bravo à l'auteur! Bien que vous puissiez l'utiliser gratuitement, n'oubliez pas que la republication du code est soumise à nos Règles.
Clause de non-responsabilité
Les informations et publications ne sont pas destinées à être, et ne constituent pas, des conseils ou recommandations financiers, d'investissement, de trading ou autres fournis ou approuvés par TradingView. Pour en savoir plus, consultez les Conditions d'utilisation.