OPEN-SOURCE SCRIPT
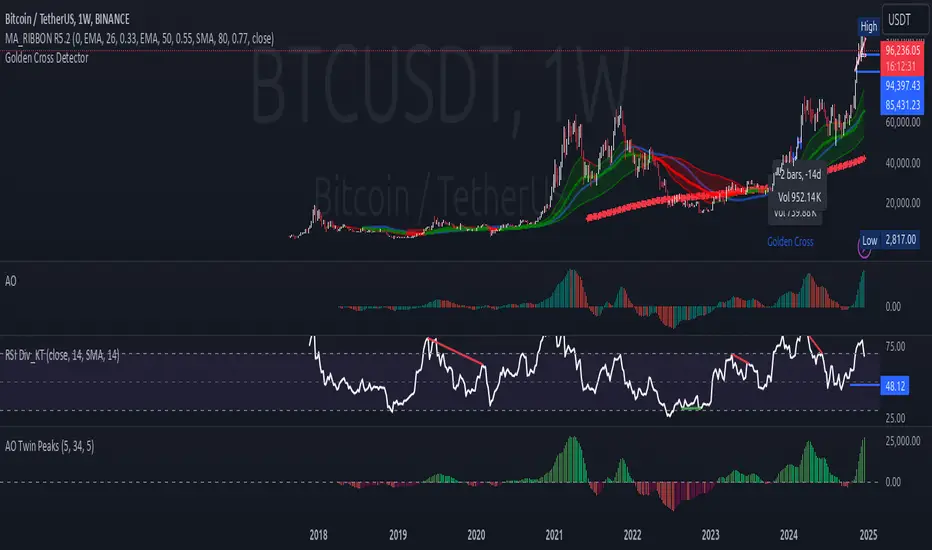
Awesome Oscillator Twin Peaks Strategy

1. The indicator identifies both bullish and bearish twin peaks:
- Bullish: Two consecutive valleys below zero, where the second valley is higher than the first
- Bearish: Two consecutive peaks above zero, where the second peak is lower than the first
2. Visual elements:
- AO histogram with color-coding for increasing/decreasing values
- Triangle markers for confirmed twin peak signals
- Zero line for reference
- Customizable colors through inputs
3. Built-in safeguards:
- Minimum separation between peaks to avoid false signals
- Maximum time window for pattern completion
- Clear signal reset conditions
4. Alert conditions for both bullish and bearish signals
To use this indicator:
1. Add it to your TradingView chart
2. Customize the input parameters if needed
3. Look for triangle markers that indicate confirmed twin peak patterns
4. Optional: Set up alerts based on the signal conditions
Script open-source
Dans l'esprit TradingView, le créateur de ce script l'a rendu open source afin que les traders puissent examiner et vérifier ses fonctionnalités. Bravo à l'auteur! Bien que vous puissiez l'utiliser gratuitement, n'oubliez pas que la republication du code est soumise à nos Règles.
Clause de non-responsabilité
Les informations et publications ne sont pas destinées à être, et ne constituent pas, des conseils ou recommandations financiers, d'investissement, de trading ou autres fournis ou approuvés par TradingView. Pour en savoir plus, consultez les Conditions d'utilisation.