OPEN-SOURCE SCRIPT
Chop Zones

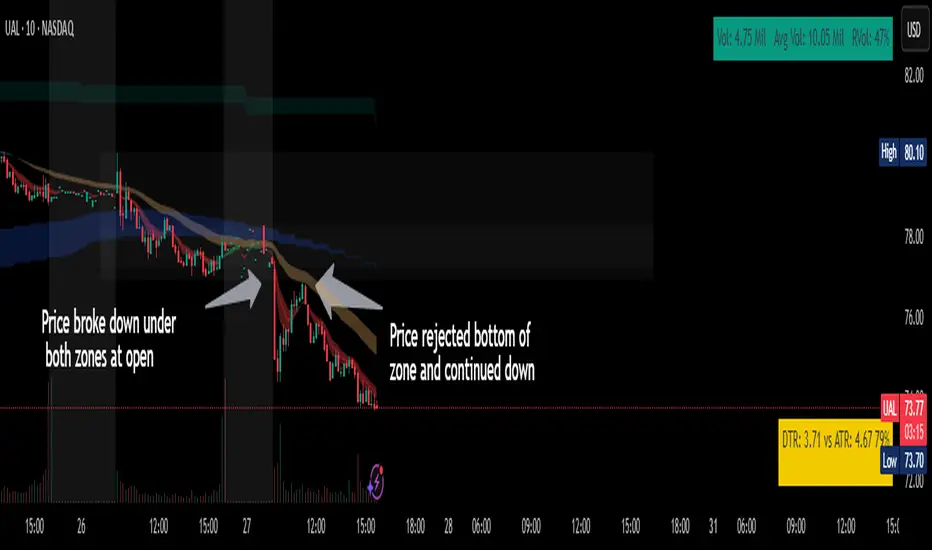
This indicator plots two "zones" in the form of shaded boxes, one between PMH and PML and one between PDH and PDL, the area that is shaded more has the highest probability of price action to be "choppy", the lesser shaded area has less probability for "choppy" action whilst outside the shaded areas there is high probability of a trend.
This indicator can be used to determine one of the three types of day:
Chop day
Bullish trend day
Bearish trend day
Chop day example today on SPY
SPY

Bullish trend day example on DLTR
DLTR

Bearish trend day example on UAL
UAL

This indicator can be used to determine one of the three types of day:
Chop day
Bullish trend day
Bearish trend day
Chop day example today on
Bullish trend day example on
Bearish trend day example on
Script open-source
Dans l'esprit TradingView, le créateur de ce script l'a rendu open source afin que les traders puissent examiner et vérifier ses fonctionnalités. Bravo à l'auteur! Bien que vous puissiez l'utiliser gratuitement, n'oubliez pas que la republication du code est soumise à nos Règles.
Clause de non-responsabilité
Les informations et publications ne sont pas destinées à être, et ne constituent pas, des conseils ou recommandations financiers, d'investissement, de trading ou autres fournis ou approuvés par TradingView. Pour en savoir plus, consultez les Conditions d'utilisation.