PROTECTED SOURCE SCRIPT
Aggressive Candle 1.0 [S1S2]
Aggressive Candle 1.0 [S1S2]
What the indicator does
This indicator highlights “aggressive” candles—bars that combine exceptional range, volume, and closing position—and optionally recolours the entire candle so they stand out. It also attaches a compact volume bubble to the very first aggressive candle in each sequence, helping you see where bursts of activity start.
How the indicator decides a candle is “aggressive”
The indicator uses four main conditions to identify aggressive candles:
Session filter – Only candles formed between 08:00 and 16:30 (exchange time) are considered.
Body size filter – The candle’s body (the absolute difference between open and close) must be larger than the Wilder moving average of the last 20 candle bodies.
Volume filter – The candle’s volume must be higher than the 50-period EMA of volume.
Placement filter – For a bullish aggressive candle, the close must be within the upper 25% of the bar’s range. For a bearish aggressive candle, the close must be within the lower 25% of the bar’s range.
If all these conditions are met, the candle is classified as bullish (green) or bearish (red), depending on its direction.
Outlier detection
For extra context the indicator maintains a 20‑period SMA + standard‑deviation channel around price:
When an aggressive candle simultaneously pierces one of those bands, its volume bubble turns white with black text to mark a possible exhaustion/climax event.
What you see on the chart
Re‑coloured candles (toggle on/off)
Non‑aggressive session bars use the colour you choose (blue by default).
Volume bubble (only on the first aggressive candle of a run).
Candle volume in thousands (e.g., “823” = 823 k).
WARNING: To visualize the candle recolor, you must drag this indicator to the top of the TradingView object tree.
Practical use & tips
Designed for intraday charts (1–15 min); works on stocks, futures, crypto (where volume exists).
Use aggressive candles as context markers - they often flag the start of momentum bursts or the tail end of sharp counter‑moves.
Combine with your own trend, structure, or order‑flow tools for confirmation; the indicator does not generate standalone buy/sell signals.
All calculations refer only to completed bars.
Disclaimer
This indicator is educational material, not financial advice. Past performance is no guarantee of future results. Trade responsibly and test thoroughly before risking capital.
Credit
Original script by Dr Stephen Harlins, ported to TradingView.
What the indicator does
This indicator highlights “aggressive” candles—bars that combine exceptional range, volume, and closing position—and optionally recolours the entire candle so they stand out. It also attaches a compact volume bubble to the very first aggressive candle in each sequence, helping you see where bursts of activity start.
How the indicator decides a candle is “aggressive”
The indicator uses four main conditions to identify aggressive candles:
Session filter – Only candles formed between 08:00 and 16:30 (exchange time) are considered.
Body size filter – The candle’s body (the absolute difference between open and close) must be larger than the Wilder moving average of the last 20 candle bodies.
Volume filter – The candle’s volume must be higher than the 50-period EMA of volume.
Placement filter – For a bullish aggressive candle, the close must be within the upper 25% of the bar’s range. For a bearish aggressive candle, the close must be within the lower 25% of the bar’s range.
If all these conditions are met, the candle is classified as bullish (green) or bearish (red), depending on its direction.
Outlier detection
For extra context the indicator maintains a 20‑period SMA + standard‑deviation channel around price:
- Lower outlier: low < SMA − 1 σ
- Upper outlier: high > SMA + 1.918 σ
When an aggressive candle simultaneously pierces one of those bands, its volume bubble turns white with black text to mark a possible exhaustion/climax event.
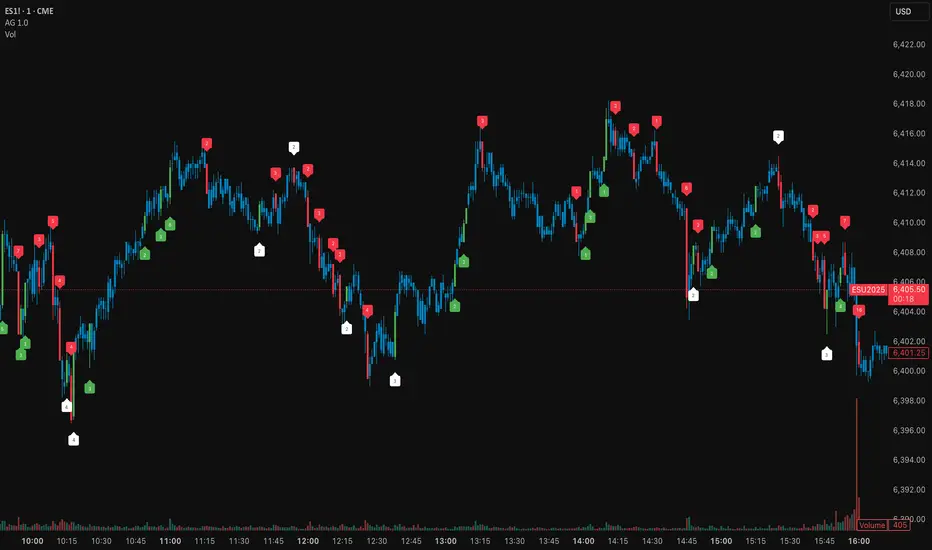
What you see on the chart
- Green = bullish aggressive
- Red = bearish aggressive
- White bubble = statistical outlier (see above).
Re‑coloured candles (toggle on/off)
Non‑aggressive session bars use the colour you choose (blue by default).
Volume bubble (only on the first aggressive candle of a run).
Candle volume in thousands (e.g., “823” = 823 k).
WARNING: To visualize the candle recolor, you must drag this indicator to the top of the TradingView object tree.
Practical use & tips
Designed for intraday charts (1–15 min); works on stocks, futures, crypto (where volume exists).
Use aggressive candles as context markers - they often flag the start of momentum bursts or the tail end of sharp counter‑moves.
Combine with your own trend, structure, or order‑flow tools for confirmation; the indicator does not generate standalone buy/sell signals.
All calculations refer only to completed bars.
Disclaimer
This indicator is educational material, not financial advice. Past performance is no guarantee of future results. Trade responsibly and test thoroughly before risking capital.
Credit
Original script by Dr Stephen Harlins, ported to TradingView.
Script protégé
Ce script est publié en source fermée. Toutefois, vous pouvez l'utiliser librement et sans aucune restriction - en savoir plus ici.
Clause de non-responsabilité
Les informations et les publications ne sont pas destinées à être, et ne constituent pas, des conseils ou des recommandations en matière de finance, d'investissement, de trading ou d'autres types de conseils fournis ou approuvés par TradingView. Pour en savoir plus, consultez les Conditions d'utilisation.