OPEN-SOURCE SCRIPT
Adaptive Market Regime Identifier [LuciTech]
What it Does:
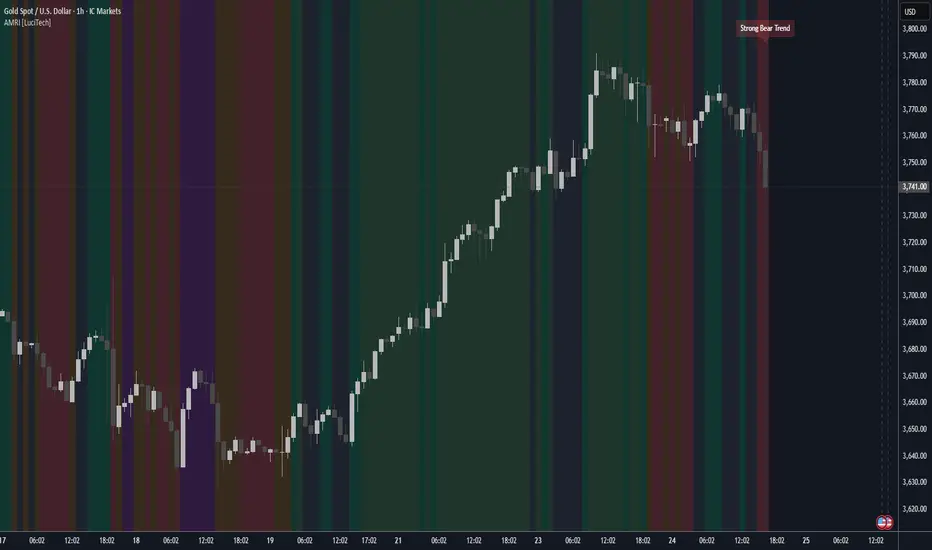
AMRI visually identifies and categorizes the market into six primary regimes directly on your chart using a color-coded background. These regimes are:
-Strong Bull Trend: Characterized by robust upward momentum and low volatility.
-Weak Bull Trend: Indicates upward momentum with less conviction or higher volatility.
-Strong Bear Trend: Defined by powerful downward momentum and low volatility.
-Weak Bear Trend: Suggests downward momentum with less force or increased volatility.
-Consolidation: Periods of low volatility and sideways price action.
-Volatile Chop: High volatility without clear directional bias, often seen during transitions or indecision.
By clearly delineating these states, AMRI helps traders quickly grasp the overarching market context, enabling them to apply strategies best suited for the current conditions (e.g., trend-following in strong trends, range-bound strategies in consolidation, or caution in volatile chop).
How it Works (The Adaptive Edge)
AMRI achieves its adaptive classification by continuously analyzing three core market dimensions, with each component dynamically adjusting to current market conditions:
1.Adaptive Moving Average (KAMA): The indicator utilizes the Kaufman Adaptive Moving Average (KAMA) to gauge trend direction and strength. KAMA is unique because it adjusts its smoothing period based on market efficiency (noise vs. direction). In trending markets, it becomes more responsive, while in choppy markets, it smooths out noise, providing a more reliable trend signal than static moving averages.
2.Adaptive Average True Range (ATR): Volatility is measured using an adaptive version of the Average True Range. Similar to KAMA, this ATR dynamically adjusts its sensitivity to reflect real-time changes in market volatility. This helps AMRI differentiate between calm, ranging markets and highly volatile, directional moves or chaotic periods.
3.Normalized Slope Analysis: The slope of the KAMA is normalized against the Adaptive ATR. This normalization provides a robust measure of trend strength that is relative to the current market volatility, making the thresholds for strong and weak trends more meaningful across different instruments and timeframes.
These adaptive components work in concert to provide a nuanced and responsive classification of the market regime, minimizing lag and reducing false signals often associated with fixed-parameter indicators.
Key Features & Originality:
-Dynamic Regime Classification: AMRI stands out by not just indicating trend or range, but by classifying the type of market regime, offering a higher-level analytical framework. This is a meta-indicator that provides context for all other trading tools.
-Adaptive Core Metrics: The use of KAMA and an Adaptive ATR ensures that the indicator remains relevant and responsive across diverse market conditions, automatically adjusting to changes in volatility and trend efficiency. This self-adjusting nature is a significant advantage over indicators with static lookback periods.
-Visual Clarity: The color-coded background provides an immediate, at-a-glance understanding of the current market regime, reducing cognitive load and allowing for quicker decision-making.
-Contextual Trading: By identifying the prevailing regime, AMRI empowers traders to select and apply strategies that are most effective for that specific environment, helping to avoid costly mistakes of using a trend-following strategy in a ranging market, or vice-versa.
-Originality: While components like KAMA and ATR are known, their adaptive integration into a comprehensive, multi-regime classification system, combined with normalized slope analysis for trend strength, offers a novel approach to market analysis not commonly found in publicly available indicators.
Script open-source
Dans l'esprit TradingView, le créateur de ce script l'a rendu open source afin que les traders puissent examiner et vérifier ses fonctionnalités. Bravo à l'auteur! Bien que vous puissiez l'utiliser gratuitement, n'oubliez pas que la republication du code est soumise à nos Règles.
Clause de non-responsabilité
Les informations et publications ne sont pas destinées à être, et ne constituent pas, des conseils ou recommandations financiers, d'investissement, de trading ou autres fournis ou approuvés par TradingView. Pour en savoir plus, consultez les Conditions d'utilisation.