OPEN-SOURCE SCRIPT
S&P 2024: Magnificent 7 vs. the rest of S&P
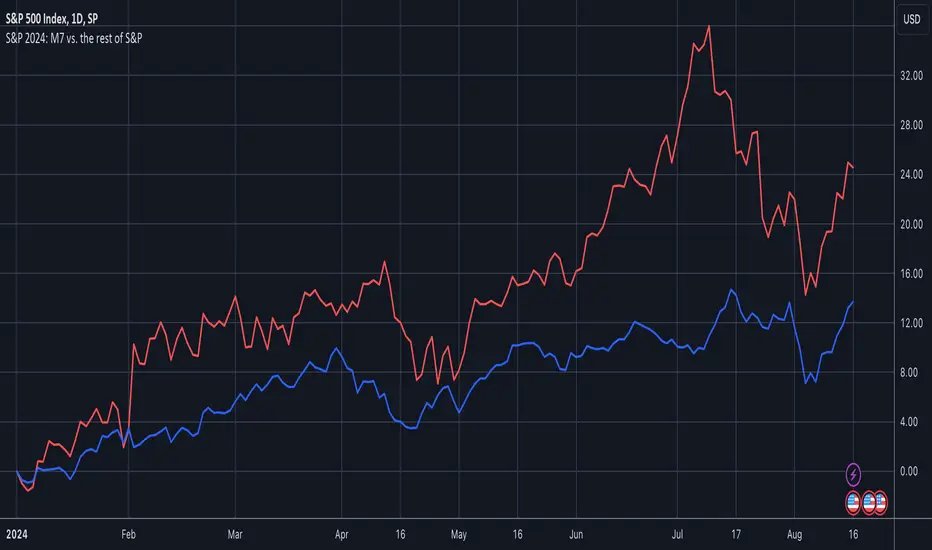
This chart is designed to calculate and display the percentage change of the Magnificent 7 (M7) stocks and the S&P 500 excluding the M7 (Ex-M7) from the beginning of 2024 to the most recent data point. The Magnificent 7 consists of seven major technology stocks: Apple (AAPL), Microsoft (MSFT), Amazon (AMZN), Alphabet (GOOGL), Meta (META), Nvidia (NVDA), and Tesla (TSLA). These stocks are a significant part of the S&P 500 and can have a substantial impact on its overall performance.
Key Components and Functionality:
1. Start of 2024 Baseline:
- The script identifies the closing prices of the S&P 500 and each of the Magnificent 7 stocks on the first trading day of 2024. These values serve as the baseline for calculating percentage changes.
2. Current Value Calculation:
- It then fetches the most recent closing prices of these stocks and the S&P 500 index to calculate their current values.
3. Percentage Change Calculation:
- The script calculates the percentage change for the M7 by comparing the sum of the current prices of the M7 stocks to their combined value at the start of 2024.
- Similarly, it calculates the percentage change for the Ex-M7 by comparing the current value of the S&P 500 excluding the M7 to its value at the start of 2024.
4. Plotting:
- The calculated percentage changes are plotted on the chart, with the M7’s percentage change shown in red and the Ex-M7’s percentage change shown in blue.
Use Case:
This indicator is particularly useful for investors and analysts who want to understand how much the performance of the S&P 500 in 2024 is driven by the Magnificent 7 stocks compared to the rest of the index. By showing the percentage change from the start of the year, it provides clear insights into the relative growth or decline of these two segments of the market over the course of the year.
Visualization:
- Red Line (M7 % Change): Displays the percentage change of the combined value of the Magnificent 7 stocks since the start of 2024.
- Blue Line (Ex-M7 % Change): Displays the percentage change of the S&P 500 excluding the Magnificent 7 since the start of 2024.
This script enables a straightforward comparison of the performance of the M7 and Ex-M7, highlighting which segment is contributing more to the overall movement of the S&P 500 in 2024.
Script open-source
Dans l'esprit TradingView, le créateur de ce script l'a rendu open source afin que les traders puissent examiner et vérifier ses fonctionnalités. Bravo à l'auteur! Bien que vous puissiez l'utiliser gratuitement, n'oubliez pas que la republication du code est soumise à nos Règles.
Clause de non-responsabilité
Les informations et publications ne sont pas destinées à être, et ne constituent pas, des conseils ou recommandations financiers, d'investissement, de trading ou autres fournis ou approuvés par TradingView. Pour en savoir plus, consultez les Conditions d'utilisation.