INVITE-ONLY SCRIPT
MXV-BSzone
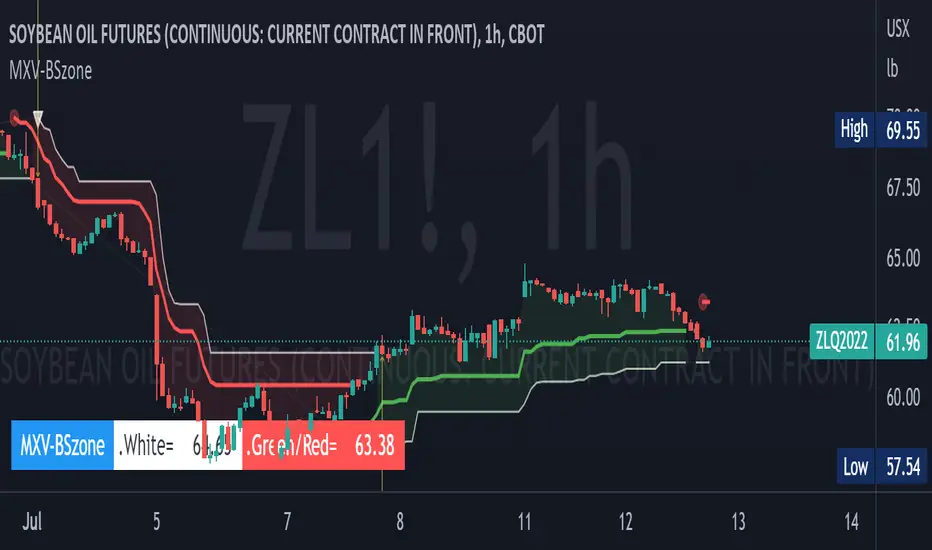
Summary: averaging down the cost of capital with lines and color zones
The strategy can include many long entries when the market is bullish or many short entries when the market is bearish hourly. And we put a stoploss order with same value for all of them.
For me, it is always dificult to detect when and at which best price exactly to stop loss and to take profit after I make an buy or sell entry in hourly time frame, so i make may entry at different price values. And i prefer make only one stoploss price for all the entries
I use 2 visual trailing lines to determine zone of stop loss or take profit in same chart.
Every 60 minutes 2 visual horizontal line will permanently stamp on the charts: red and white.
When to Sell
- When the market is bearish in daily time frame, red line will be marked in H1 time frame as for sell zone. And when candles move up near or cut cross over the red line (we call it: action moment), it is recommended that we should short and make a stoploss at price of the white line (white line in this situation is higher than the red line). I can take profit whenever I have time to watch chart.
When to buy
- When the market is bullish in daily time frame, green line will be marked in H1 time frame as for buy zone. And when candles move down near or cut cross over the green line (we call it: action moment), it is recommended that we should long and make a stoploss at price of the white line (white line in this situation is beneath the green line). I can take profit whenever I have time to watch chart.
* When I miss an action moment, i will need to wait until the next action moments appear and make an entry (or many) then rapidly make an trailing exit with white line value (price) reducing risk
The strategy works fine
Script sur invitation seulement
L'accès à ce script est limité aux utilisateurs autorisés par l'auteur et nécessite généralement un paiement. Vous pouvez l'ajouter à vos favoris, mais vous ne pourrez l'utiliser qu'après avoir demandé et obtenu l'autorisation de son auteur. Contactez muzikalink pour plus d'informations, ou suivez les instructions de l'auteur ci-dessous.
TradingView ne suggère pas de payer pour un script et de l'utiliser à moins que vous ne fassiez confiance à 100% à son auteur et que vous compreniez comment le script fonctionne. Dans de nombreux cas, vous pouvez trouver une bonne alternative open-source gratuite dans nos Scripts communautaires.
Instructions de l'auteur
″Not ready to earth contact !
Vous voulez utiliser ce script sur un graphique ?
Avertissement: veuillez lire avant de demander l'accès.
Clause de non-responsabilité
Les informations et les publications ne sont pas destinées à être, et ne constituent pas, des conseils ou des recommandations en matière de finance, d'investissement, de trading ou d'autres types de conseils fournis ou approuvés par TradingView. Pour en savoir plus, consultez les Conditions d'utilisation.