OPEN-SOURCE SCRIPT
Mis à jour 10 Minute Futures Session Open Range
Inspired by SamRecio's 30sec OR script.
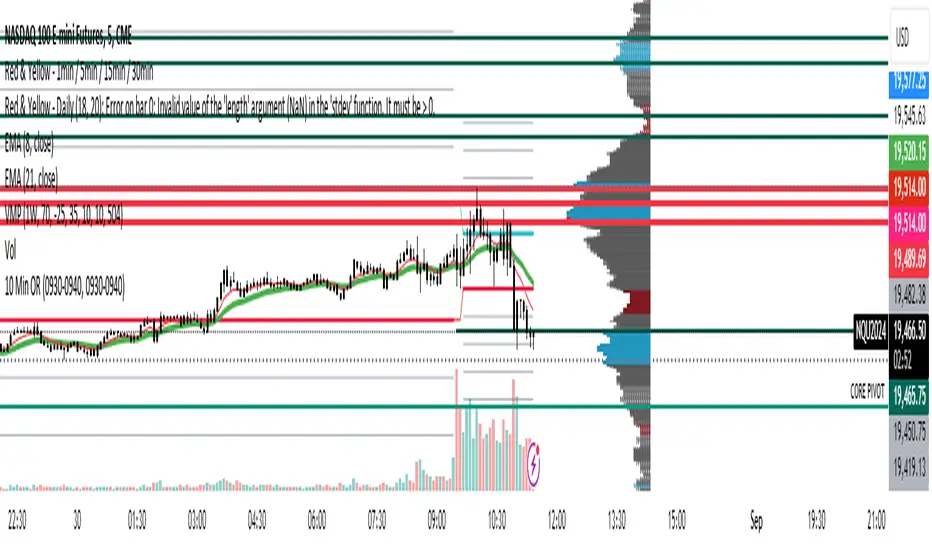
The 10 minute Opening Range (OR) dynamically identifies and visualizes the opening range of a trading session within the first 10 minutes after the market opens at 9:30 AM EST, concluding at 4:00 PM EST, reflecting the typical trading hours for U.S. stock exchanges. This indicator is particularly useful for strategies that rely on the initial market momentum and direction established during the early moments of the trading session.
Upon activation, the indicator calculates the highest (orHigh) and lowest (orLow) price levels reached during the first 10 minutes of the trading session, marking these levels with green (for the high) and red (for the low) lines directly on the chart overlay. Additionally, it computes and plots a midpoint (midPoint) between these high and low levels, displayed as a blue line, offering a visual reference for the median of the opening range.
The calculations are reset daily to ensure the indicator accurately reflects the opening range for each new trading session. By doing so, it avoids carrying over data from previous days, maintaining relevance and precision for day traders and those utilizing short-term trading strategies. The indicator also incorporates timezone adjustments to align with the America/New_York timezone, ensuring that the opening range is accurately captured regardless of the user's local timezone.
This tool is invaluable for traders looking to capitalize on breakout or reversion strategies around the opening range, providing clear visual cues for significant price levels established at the start of the trading session. By focusing on the first 10 minutes of trading, it caters to a specific segment of the market that believes the initial movements can set the tone for the rest of the day's trading activity.
Notes de version
Updated Previous Version to include extension targets (credit to MichiganDolf)The 10 minute Opening Range (OR) dynamically identifies and visualizes the opening range of a trading session within the first 10 minutes after the market opens at 9:30 AM EST, concluding at 4:00 PM EST, reflecting the typical trading hours for U.S. stock exchanges. This indicator is particularly useful for strategies that rely on the initial market momentum and direction established during the early moments of the trading session.
Upon activation, the indicator calculates the highest (orHigh) and lowest (orLow) price levels reached during the first 10 minutes of the trading session, marking these levels with green (for the high) and red (for the low) lines directly on the chart overlay. Additionally, it computes and plots a midpoint (midPoint) between these high and low levels, displayed as a blue line, offering a visual reference for the median of the opening range.
The calculations are reset daily to ensure the indicator accurately reflects the opening range for each new trading session. By doing so, it avoids carrying over data from previous days, maintaining relevance and precision for day traders and those utilizing short-term trading strategies. The indicator also incorporates timezone adjustments to align with the America/New_York timezone, ensuring that the opening range is accurately captured regardless of the user's local timezone.
This tool is invaluable for traders looking to capitalize on breakout or reversion strategies around the opening range, providing clear visual cues for significant price levels established at the start of the trading session. By focusing on the first 10 minutes of trading, it caters to a specific segment of the market that believes the initial movements can set the tone for the rest of the day's trading activity.
Notes de version
Fixed timeframe selection changing the opening range. Static now across all timeframesScript open-source
Dans l'esprit TradingView, le créateur de ce script l'a rendu open source afin que les traders puissent examiner et vérifier ses fonctionnalités. Bravo à l'auteur! Bien que vous puissiez l'utiliser gratuitement, n'oubliez pas que la republication du code est soumise à nos Règles.
Clause de non-responsabilité
Les informations et publications ne sont pas destinées à être, et ne constituent pas, des conseils ou recommandations financiers, d'investissement, de trading ou autres fournis ou approuvés par TradingView. Pour en savoir plus, consultez les Conditions d'utilisation.
Script open-source
Dans l'esprit TradingView, le créateur de ce script l'a rendu open source afin que les traders puissent examiner et vérifier ses fonctionnalités. Bravo à l'auteur! Bien que vous puissiez l'utiliser gratuitement, n'oubliez pas que la republication du code est soumise à nos Règles.
Clause de non-responsabilité
Les informations et publications ne sont pas destinées à être, et ne constituent pas, des conseils ou recommandations financiers, d'investissement, de trading ou autres fournis ou approuvés par TradingView. Pour en savoir plus, consultez les Conditions d'utilisation.