PROTECTED SOURCE SCRIPT
VIX (StevenCharts)
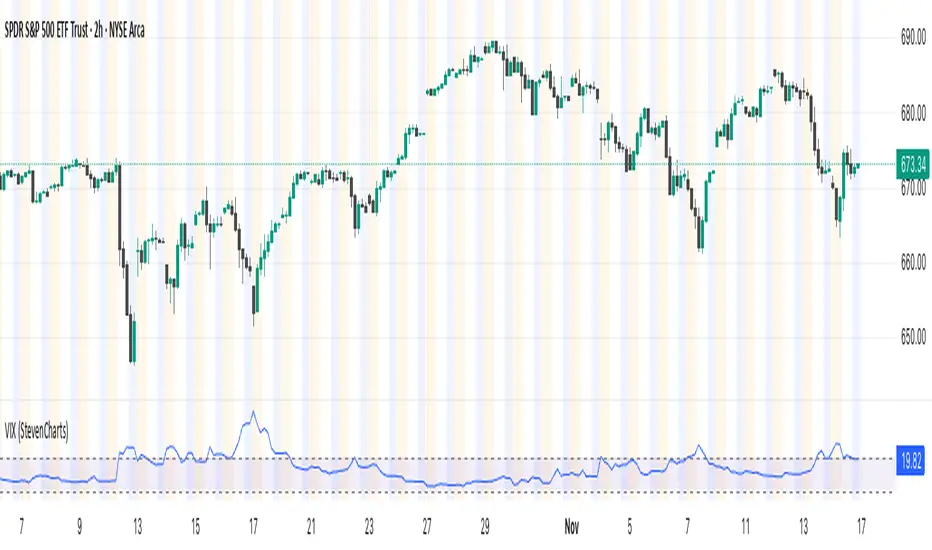
This indicator plots the VIX (CBOE Volatility Index) in a separate pane to help you quickly gauge market sentiment and volatility.
It highlights the key zone between 15 and 20, which often acts as a transition area between low and high-volatility regimes.
Features:
Plots the VIX line.
Allows you to change the color of the VIX line.
It highlights the key zone between 15 and 20, which often acts as a transition area between low and high-volatility regimes.
Features:
Plots the VIX line.
Allows you to change the color of the VIX line.
Script protégé
Ce script est publié en source fermée. Cependant, vous pouvez l'utiliser librement et sans aucune restriction – pour en savoir plus, cliquez ici.
Clause de non-responsabilité
Les informations et publications ne sont pas destinées à être, et ne constituent pas, des conseils ou recommandations financiers, d'investissement, de trading ou autres fournis ou approuvés par TradingView. Pour en savoir plus, consultez les Conditions d'utilisation.