OPEN-SOURCE SCRIPT
Mis à jour Multi‑Timeframe RSIOMA Dashboard
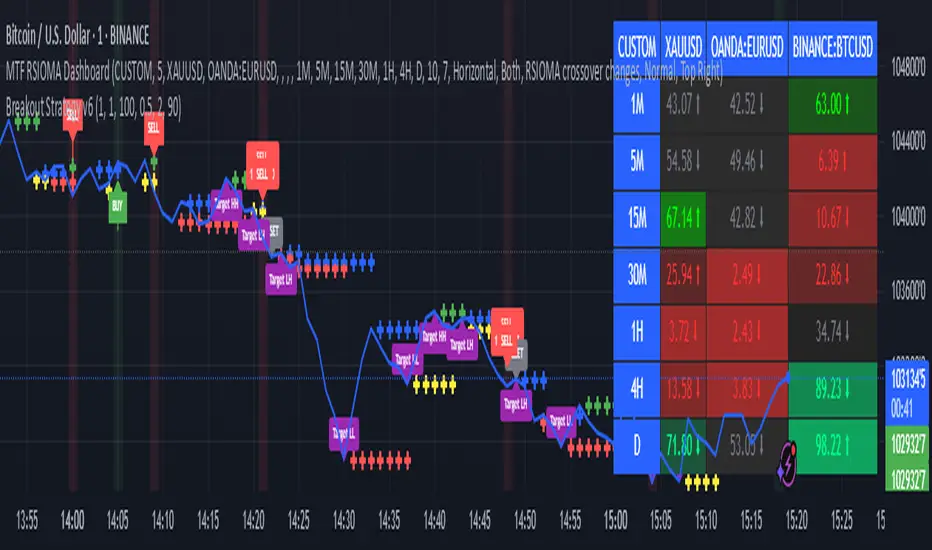
The Multi-Timeframe RSIOMA Dashboard is a TradingView tool that displays RSIOMA (Relative Strength Index Over Moving Average) values for up to 10 symbols across multiple timeframes in a color-coded table. It helps traders spot bullish (>50, green) or bearish (<50, red) momentum, with optional MA smoothing for clearer trends. Customize symbols, timeframes, and settings to track market strength at a glanc
Notes de version
UPDATE Notes de version
UPDATENotes de version
UPDATENotes de version
update Notes de version
updateNotes de version
UPDATENotes de version
updateNotes de version
UPDATENotes de version
update Notes de version
UPDATE Script open-source
Dans l'esprit TradingView, le créateur de ce script l'a rendu open source afin que les traders puissent examiner et vérifier ses fonctionnalités. Bravo à l'auteur! Bien que vous puissiez l'utiliser gratuitement, n'oubliez pas que la republication du code est soumise à nos Règles.
Clause de non-responsabilité
Les informations et publications ne sont pas destinées à être, et ne constituent pas, des conseils ou recommandations financiers, d'investissement, de trading ou autres fournis ou approuvés par TradingView. Pour en savoir plus, consultez les Conditions d'utilisation.
Script open-source
Dans l'esprit TradingView, le créateur de ce script l'a rendu open source afin que les traders puissent examiner et vérifier ses fonctionnalités. Bravo à l'auteur! Bien que vous puissiez l'utiliser gratuitement, n'oubliez pas que la republication du code est soumise à nos Règles.
Clause de non-responsabilité
Les informations et publications ne sont pas destinées à être, et ne constituent pas, des conseils ou recommandations financiers, d'investissement, de trading ou autres fournis ou approuvés par TradingView. Pour en savoir plus, consultez les Conditions d'utilisation.