PROTECTED SOURCE SCRIPT
Mis à jour Price-Mapped Multi-Cycle Sine Waves
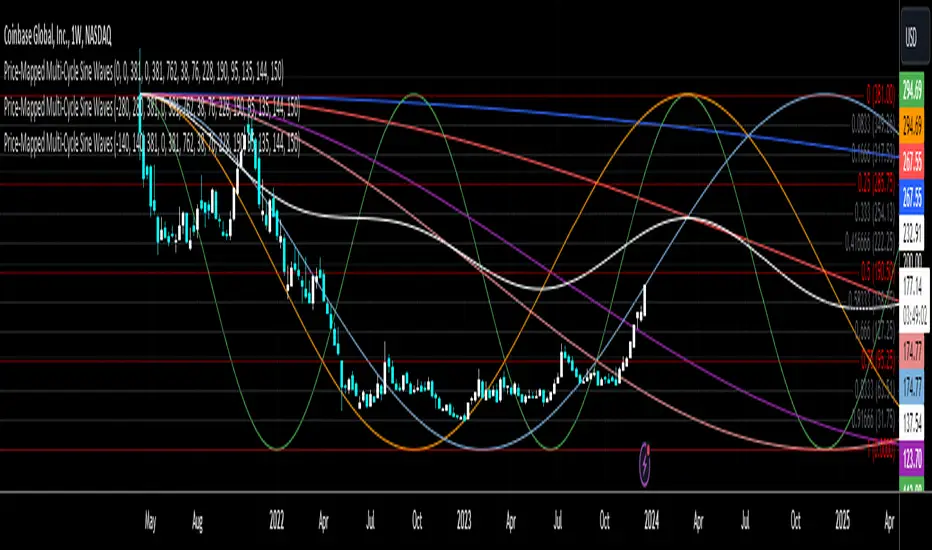
The primary function is to overlay a series of sine wave patterns onto a chart, providing a nuanced and visually intuitive representation of market dynamics.
Key features of this script include:
User-Defined Parameters: It allows users to input various parameters such as start bar (of the sine wave, so that we can start at a dynamic point), start date of the cycle plots, price range, and cycle lengths. These parameters enable customization of the sine wave patterns according to the user's specific analytical needs.
Multiple Sine Wave Cycles: It can generate up to ten different sine wave cycles, each with its own length and activation toggle.
Dynamic Visualization: The script plots these sine waves on the TradingView chart, each with a distinct color and the ability to offset the waves based on user input. This visual differentiation aids in easy identification and comparison of the different cycles.
Average Wave Calculation: Additionally, the script calculates an average wave based on the enabled cycles, providing a consolidated view of the market movement trends.
In essence, this script is a versatile tool for technical analysts and traders, offering a unique way to visualize and analyze market cycles and trends through the lens of sine wave theory. It stands as a testament to the confluence of mathematical elegance and practical financial analysis.
Notes de version
An update to the image that was shared on this landing pageScript protégé
Ce script est publié en source fermée. Cependant, vous pouvez l'utiliser librement et sans aucune restriction – pour en savoir plus, cliquez ici.
Clause de non-responsabilité
Les informations et publications ne sont pas destinées à être, et ne constituent pas, des conseils ou recommandations financiers, d'investissement, de trading ou autres fournis ou approuvés par TradingView. Pour en savoir plus, consultez les Conditions d'utilisation.
Script protégé
Ce script est publié en source fermée. Cependant, vous pouvez l'utiliser librement et sans aucune restriction – pour en savoir plus, cliquez ici.
Clause de non-responsabilité
Les informations et publications ne sont pas destinées à être, et ne constituent pas, des conseils ou recommandations financiers, d'investissement, de trading ou autres fournis ou approuvés par TradingView. Pour en savoir plus, consultez les Conditions d'utilisation.