PROTECTED SOURCE SCRIPT
Market Risk

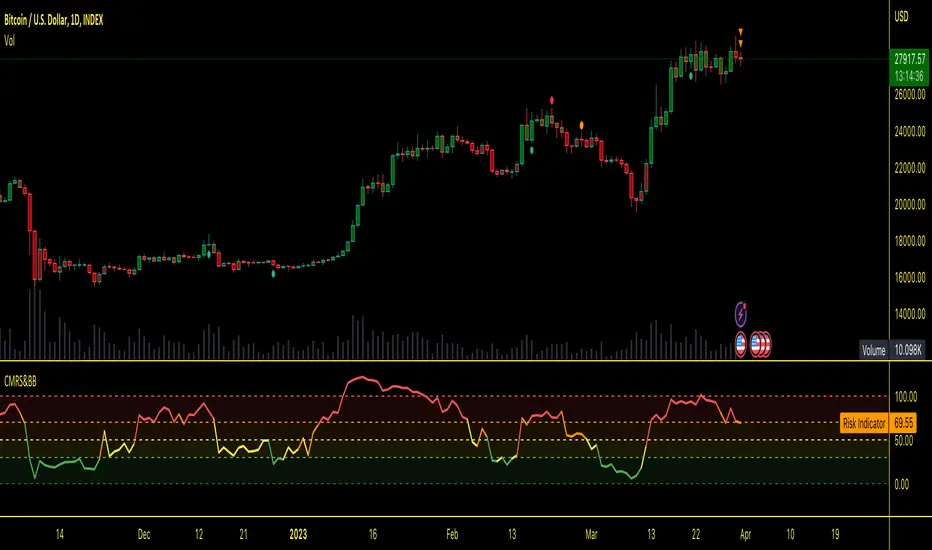
This Pine Script defines an indicator called "Custom Market Risk, Sentiment & Bollinger Bands Indicator" with the short title "CMRS&BB". The indicator calculates risk, sentiment, and Bollinger Bands Percent based on technical indicators and user inputs.
The risk calculation is based on the difference between the current close price and the previous close price, and the average gain and loss over a specified period are calculated. The relative strength index is then calculated by dividing the average gain by the average loss. The risk is calculated using a formula that involves the relative strength index.
The sentiment calculation is based on three technical indicators, and the sentiment score is calculated as the average of the signals generated by these indicators. The sentiment is considered positive if the sentiment score is greater than 0.
The Bollinger Bands Percent is calculated based on the length and multiplier inputs, the moving average, and the standard deviation of the close price. The upper and lower bands are calculated based on the basis and deviation. The Bollinger Bands Percent is then calculated as the ratio of the difference between the close price and the lower band to the difference between the upper and lower bands.
The combined signal is calculated by adding the risk, sentiment score multiplied by a factor, and Bollinger Bands Percent multiplied by a factor. The risk levels are color-coded based on the combined signal, and the corresponding color-coded risk levels are plotted. The horizontal lines and fills representing the risk levels are also plotted. The candle color is set based on the sentiment, where green represents positive sentiment, and red represents negative sentiment.
It is important to note that this script is not intended to provide specific buy or sell signals. However, green color-coded risk levels may indicate a possible buy moment, while red color-coded risk levels may indicate a possible sell moment. It is recommended to perform additional analysis and consider other factors before making any trading decisions.
Script protégé
Ce script est publié en source fermée. Cependant, vous pouvez l'utiliser librement et sans aucune restriction – pour en savoir plus, cliquez ici.
CJ
Clause de non-responsabilité
Les informations et publications ne sont pas destinées à être, et ne constituent pas, des conseils ou recommandations financiers, d'investissement, de trading ou autres fournis ou approuvés par TradingView. Pour en savoir plus, consultez les Conditions d'utilisation.