PROTECTED SOURCE SCRIPT
Mis à jour Momentum Buy/Sell signals (Nikko) v1.0
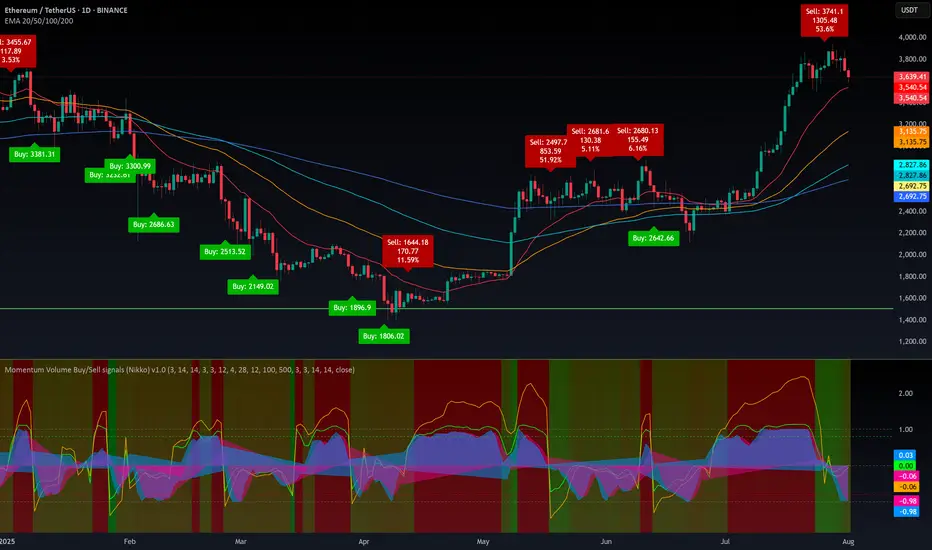
📊 Momentum Volume Box Range Buy/Sell Signals (Nikko) v1.0
This indicator is a multi-factor momentum-based tool that helps identify potential Buy and Sell signals:
🔍 What it does
It combines several well-known indicators into a hybrid signal system and displays heatmaps, momentum lines, and Buy/Sell labels.
📈 How to use it
Buy Signals are shown when the hybrid K line crosses above D line in strong downward zones (oversold).
Sell Signals appear when K crosses below D, but only if a minimum profit % is reached since the last Buy.
The background heatmap color changes based on combined RSI and Vortex intensity:
Greenish = Bullish strength
Reddish = Bearish weakness
🟢 Buy/Sell Labels
Buy Labels: Triggered when strong downward momentum reverses (or price drops deeply).
Sell Labels: Only shown if price has moved up by the user-defined % profit since the last Buy.
🔧 Customization Options
You can toggle on/off:
Heatmap
Hybrid signal lines
Buy/Sell labels
Stochastic RSI area plot
Volume range and profile
EMA overlays (20, 50, 100, 200)
All major color elements are adjustable for visual clarity.
💡 Best Practices
Use on any timeframe, but it works best with higher timeframes (1H+).
Look for convergence between strong heatmap color and hybrid signal crossover.
Combine with price action or EMA trend context for better accuracy.
Note: This indicator is designed as a trading companion, not a standalone strategy. It combines multiple timeframes and parameters that would be difficult to monitor manually. Its purpose is to visually simplify complex signals, helping reduce the risk of poor entries.
However, it's essential to also consider macroeconomic factors, news events, and overall market sentiment, as they can significantly impact price action. Always use proper risk management and do your own research (DYOR).
Notes de version
I have cleaned the chart, sorry about it.Notes de version
I again cleaned the chart (it didn't worked previously)Notes de version
- removeing some useless parameters (left by error)- fixed the hide Stochastic RSI option
Notes de version
- improved visibility of the SRSI fills (can be removed in the options)Script protégé
Ce script est publié en source fermée. Cependant, vous pouvez l'utiliser librement et sans aucune restriction – pour en savoir plus, cliquez ici.
Twitter X: x.com/cryptonikkoid
Web: nikkoid.com
I do not answer to private messages. Use the comment section of the idea or script, or use Telegram.
Web: nikkoid.com
I do not answer to private messages. Use the comment section of the idea or script, or use Telegram.
Clause de non-responsabilité
Les informations et publications ne sont pas destinées à être, et ne constituent pas, des conseils ou recommandations financiers, d'investissement, de trading ou autres fournis ou approuvés par TradingView. Pour en savoir plus, consultez les Conditions d'utilisation.
Script protégé
Ce script est publié en source fermée. Cependant, vous pouvez l'utiliser librement et sans aucune restriction – pour en savoir plus, cliquez ici.
Twitter X: x.com/cryptonikkoid
Web: nikkoid.com
I do not answer to private messages. Use the comment section of the idea or script, or use Telegram.
Web: nikkoid.com
I do not answer to private messages. Use the comment section of the idea or script, or use Telegram.
Clause de non-responsabilité
Les informations et publications ne sont pas destinées à être, et ne constituent pas, des conseils ou recommandations financiers, d'investissement, de trading ou autres fournis ou approuvés par TradingView. Pour en savoir plus, consultez les Conditions d'utilisation.