TradeWiserBE_V1
It's often difficult to spot them with the eyes when you are typically new to the trading world. Hence this indicator came in handy. The indicator helps you to plot the key support and resistance areas on the chart which will guide you in making informed trades wiser.
Sometimes prices shoot however it may not have the significant volume to support the movement, basically faking the levels to trap traders, this indicator should help you in identifying those momentum candles. Have used moving averages and certain levels of volume spikes to identify and spot the candle strength.
Traders may also trade the diverges between momentum and the price vs volume. Helps you to spot the pure divergences and plots them on the chart.
wondering why after a certain level of price stretch during the day trading, it tends to act crazy, and all the price action strategy fails even after multiple confirmations. The majority of traders including self fail to read the chart the proper way. Hence it made me develop this indicator so that I can be sure of what is happening on the chart. ATR is used to calculate the plot the same.
If you are an options trader you may also use this indicator as a guide in order to estimate how much an option price would move at each level. Mathematical calculations are being used in order to arrive at the estimated option values.
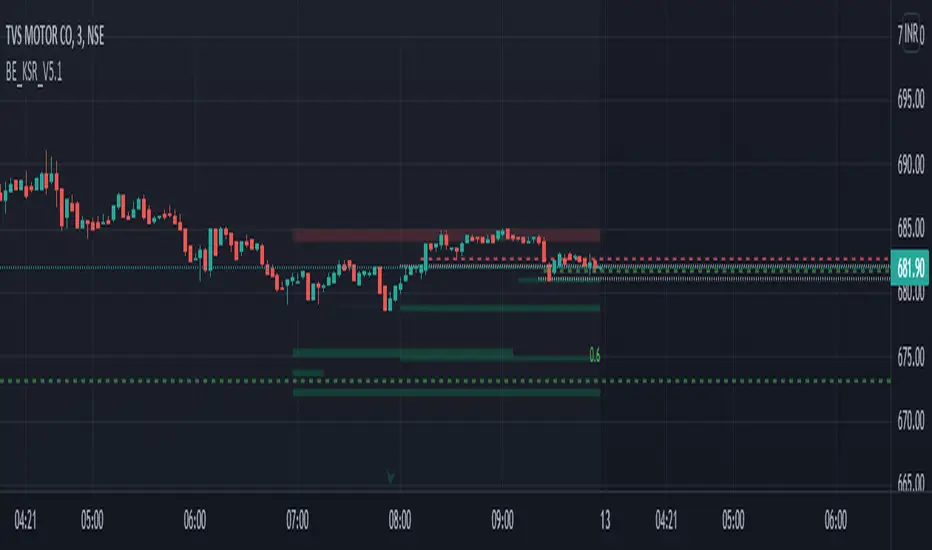
This is a typical price action indicator plotting the key support and resistance on the timeframe traded
What it can do?
1. Early signs of reversal
2. helps you to decide when to enter and exit.
3. Day Range.
4. Option price estimates.
What calculations consist of?
1. ATR
2. Price stop and move points.
3. BBP
4. Averages
5. Mathematical calculations.
1. Bug Fixed in Pullback Line : Removed the Extra Un-Necessary Lines which was all over the chart
2. Bug Fixed : Users may have the option to check or uncheck to see the (Major) Key Buyers | Seller Price Line (Red | Green Dotted Lines)
3. Option Added: Regular Fibonaaci levels.
Plz do PM me for further questions if you have.
Given an option to choose other price & momentum related technical indicator along with MACD to spot the divergence.
Channel Trading has been giving a good amount of fruitful trade setups and its quite easy to trade the same, considering the risk to reward ratio it provides. Long Fibo channel usually do not slope downwards and vise-versa for Short Fibo Channel. It requires couple of considerations to be made before concluding the valid trade setup like. No of candles it took to form a Triangle, angle of the triangle (LL to HL for long setup & HH to LH for short setup)
With all these factors, options have been provided to the users of this indicator to filter out the respective setups.
1. Strong Channel (Lesser No of Candles Involved to form a triangle & the angle is co-ordinates defining the Strength)
2. Slightly Strong Channel (Similar to Strong with couple of Error Rate)
3. Weak Channel (Higher No of Candles Involved to form a triangle & the volatility is to slow due to its consolidation)
4. High Volatile Channel (Triangles having Higher volatility)
Couple of customizable options like setting the Target points, Colors and SL Range have been provided accordingly.
Script sur invitation seulement
Seuls les utilisateurs approuvés par l'auteur peuvent accéder à ce script. Vous devrez demander et obtenir l'autorisation pour l'utiliser. Celle-ci est généralement accordée après paiement. Pour plus de détails, suivez les instructions de l'auteur ci-dessous ou contactez directement TradeWiseWithEase.
TradingView ne recommande PAS d'acheter ou d'utiliser un script à moins que vous ne fassiez entièrement confiance à son auteur et que vous compreniez son fonctionnement. Vous pouvez également trouver des alternatives gratuites et open source dans nos scripts communautaires.
Instructions de l'auteur
Clause de non-responsabilité
Script sur invitation seulement
Seuls les utilisateurs approuvés par l'auteur peuvent accéder à ce script. Vous devrez demander et obtenir l'autorisation pour l'utiliser. Celle-ci est généralement accordée après paiement. Pour plus de détails, suivez les instructions de l'auteur ci-dessous ou contactez directement TradeWiseWithEase.
TradingView ne recommande PAS d'acheter ou d'utiliser un script à moins que vous ne fassiez entièrement confiance à son auteur et que vous compreniez son fonctionnement. Vous pouvez également trouver des alternatives gratuites et open source dans nos scripts communautaires.