OPEN-SOURCE SCRIPT
VWAP Bands @shrilss
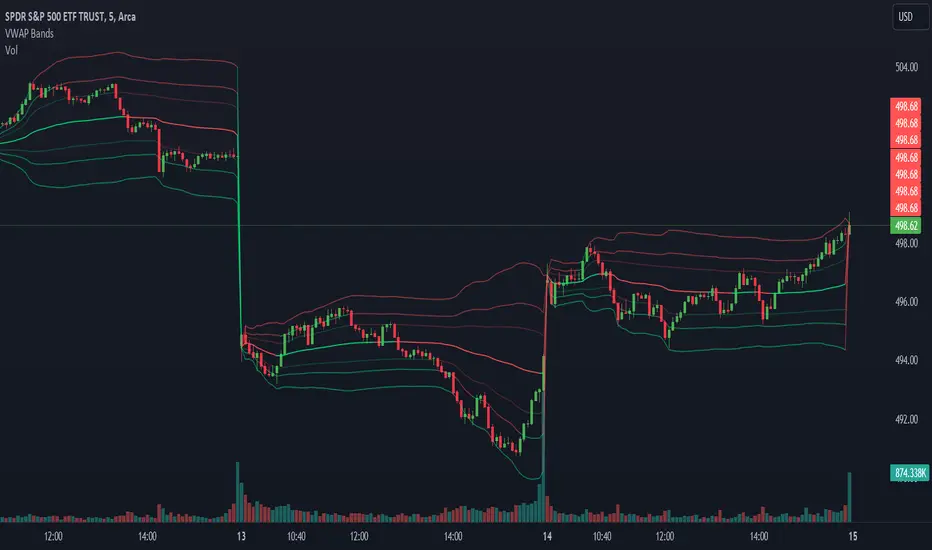
VWAP Bands Integrates VWAP with standard deviation bands to provide traders with insights into potential support and resistance levels based on volume dynamics. VWAP is a key metric used by institutional traders to gauge the average price a security has traded at throughout the trading day, taking into account both price and volume.
This script calculates the VWAP for each trading session and overlays it on the price chart as a solid line. Additionally, it plots multiple standard deviation bands around the VWAP to indicate potential areas of price extension or contraction. These bands are derived from multiplying the standard deviation of price by predetermined factors, offering traders a visual representation of potential price ranges.
This script calculates the VWAP for each trading session and overlays it on the price chart as a solid line. Additionally, it plots multiple standard deviation bands around the VWAP to indicate potential areas of price extension or contraction. These bands are derived from multiplying the standard deviation of price by predetermined factors, offering traders a visual representation of potential price ranges.
Script open-source
Dans l'esprit TradingView, le créateur de ce script l'a rendu open source afin que les traders puissent examiner et vérifier ses fonctionnalités. Bravo à l'auteur! Bien que vous puissiez l'utiliser gratuitement, n'oubliez pas que la republication du code est soumise à nos Règles.
Clause de non-responsabilité
Les informations et publications ne sont pas destinées à être, et ne constituent pas, des conseils ou recommandations financiers, d'investissement, de trading ou autres fournis ou approuvés par TradingView. Pour en savoir plus, consultez les Conditions d'utilisation.