PROTECTED SOURCE SCRIPT
Mis à jour Otekura Range Trade Algorithm [Chain Hood]
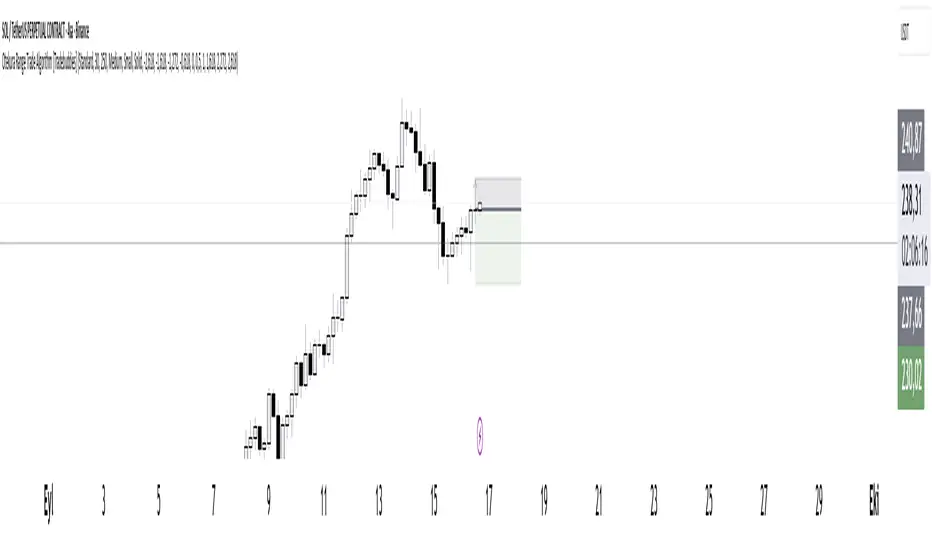
The Range Trade Algorithm calculates the levels for Monday.
On the chart you will see that the Monday levels will be marked as 1 0 -1.
The M High level calculates Monday's high close and plots it on the screen.
M Low calculates the low close of Monday and plots it on the screen.
The coloured lines on the screen are the points of the range levels formulated with fibonacci values.
The indicator has its own Value table. The prices of the levels are written.
Potential Range breakout targets tell prices at points matching the fibonacci values. These are Take profit or reversal points.
Buy and Sell indicators are determined by the range breakout.
Users can set an alarm on the indicator and receive direct notification with their targets when a new range occurs.
Fib values are multiplied by range values and create an average target according to the price situation. These values represent an area. Breakdown targets show that the target is targeted until the area.
Notes de version
.Script protégé
Ce script est publié en source fermée. Cependant, vous pouvez l'utiliser librement et sans aucune restriction – pour en savoir plus, cliquez ici.
Clause de non-responsabilité
Les informations et publications ne sont pas destinées à être, et ne constituent pas, des conseils ou recommandations financiers, d'investissement, de trading ou autres fournis ou approuvés par TradingView. Pour en savoir plus, consultez les Conditions d'utilisation.
Script protégé
Ce script est publié en source fermée. Cependant, vous pouvez l'utiliser librement et sans aucune restriction – pour en savoir plus, cliquez ici.
Clause de non-responsabilité
Les informations et publications ne sont pas destinées à être, et ne constituent pas, des conseils ou recommandations financiers, d'investissement, de trading ou autres fournis ou approuvés par TradingView. Pour en savoir plus, consultez les Conditions d'utilisation.