OPEN-SOURCE SCRIPT
Earnings Date Highlighter - from0_to_1
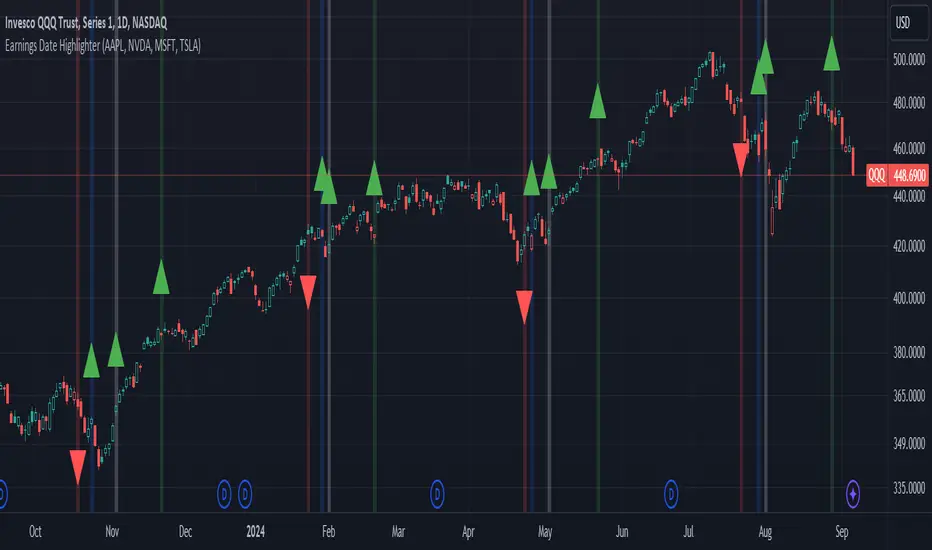
This indicator, called "Earnings Date Highlighter," is designed to visualize earnings data for up to four different stocks on a single chart. It's particularly useful for traders or investors who want to track earnings events for multiple companies simultaneously, such as the top holdings of an ETF.
Key features:
1. Tracks earnings data (estimates and actuals) for four user-defined symbols.
2. Plots earnings data points with customizable colors for each symbol.
3. Highlights earnings dates with background colors.
4. Displays green up arrows for earnings beats and red down arrows for earnings misses.
Why someone would use it:
1. To monitor earnings events for multiple stocks in a single view.
2. To quickly identify potential market-moving events for key components of an ETF or portfolio.
3. To spot patterns in earnings performance across different companies or sectors.
4. To help with timing trades or adjusting positions around earnings announcements.
This tool can be particularly valuable for investors focused on ETFs, as it allows them to visualize earnings dates and performance for the ETF's major holdings all in one place, potentially providing insights into how the ETF might behave around these key events.
Author:
tradingview.com/u/from0_to_1/
Script open-source
Dans l'esprit TradingView, le créateur de ce script l'a rendu open source afin que les traders puissent examiner et vérifier ses fonctionnalités. Bravo à l'auteur! Bien que vous puissiez l'utiliser gratuitement, n'oubliez pas que la republication du code est soumise à nos Règles.
Disclaimer: Not a personal finance professional or financial advisor. Any and all publications are opinion and not investment advice.
Clause de non-responsabilité
Les informations et publications ne sont pas destinées à être, et ne constituent pas, des conseils ou recommandations financiers, d'investissement, de trading ou autres fournis ou approuvés par TradingView. Pour en savoir plus, consultez les Conditions d'utilisation.