PROTECTED SOURCE SCRIPT
Delta Pro -> PROFABIGHI_CAPITAL
🌟 Overview
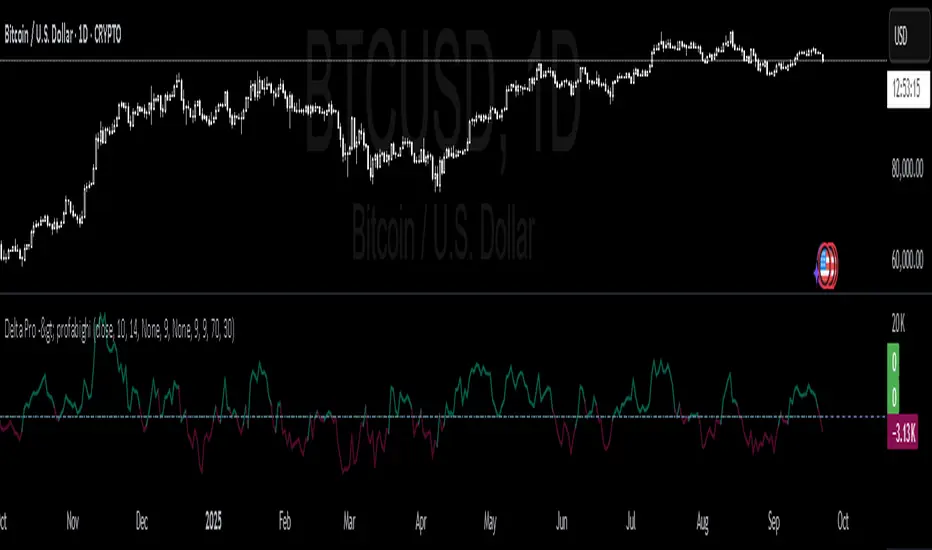
This Delta Pro → PROFABIGHI_CAPITAL implements an advanced delta analysis framework combining price delta calculations with RSI-of-momentum analysis, volume-weighted directional pressure measurement, and cumulative volume delta tracking for comprehensive order flow assessment.
It provides Price Delta calculation with RSI-of-Delta analysis using nine advanced smoothing methodologies for momentum-of-momentum assessment, Volume Delta approximation using volume weighted by price direction for buying/selling pressure identification, Cumulative Volume Delta (CVD) tracking with dynamic histogram visualization for long-term order flow trends, and Dual-mode display system enabling toggle between price delta and RSI-of-delta visualization for professional market microstructure analysis.
🔧 Advanced Delta Pro Architecture Framework
- Professional market microstructure analysis system integrating price momentum with volume-weighted directional analysis and RSI-based momentum assessment
- Grouped Input Organization separating Price Delta Calculation, RSI of Price Delta Settings, Display Options, and Volume Delta Options for streamlined configuration
- Source Configuration Framework enabling close, open, high, low, or composite price inputs for flexible delta calculation adaptation
- Period Management System with adjustable lookback periods for price delta calculation affecting both momentum and volume delta analysis
- Overlay Integration Design optimized as separate pane indicator with volume formatting for dedicated delta analysis focus
- Professional Timeframe Support enabling multi-timeframe delta analysis for different market perspective assessments
📊 Price Delta Implementation Engine
- Period-Based Delta Calculation measuring price difference between current bar and specified periods ago for momentum foundation
- Configurable Source Selection supporting different price inputs for various delta calculation approaches and market analysis
- Null Value Protection ensuring continuous calculation through proper handling of undefined historical values and edge cases
- Dynamic Color Coding using teal for positive price delta and maroon for negative price delta with optimized transparency
- Conditional Display Logic showing price delta only when RSI-of-delta mode is disabled for clean visualization switching
- Zero Line Reference providing conditional zero line display specifically for price delta analysis context
📈 RSI-of-Delta Advanced Framework
- RSI Calculation on Delta Values applying traditional RSI methodology to price delta instead of direct price for momentum-of-momentum analysis
- Dual-Layer Smoothing System providing primary and secondary moving average smoothing with nine advanced smoothing methodologies
- Advanced Moving Average Support including SMA, EMA, WMA, HMA, RMA, LSMA, DEMA, TEMA, and VIDYA for comprehensive signal refinement
- VIDYA Volatility Adaptation implementing Variable Index Dynamic Average with configurable volatility lookback for market condition responsiveness
- Dual-MA Comparison Mode enabling crossover analysis between two independently smoothed RSI-of-delta lines for advanced signal generation
- RSI Level Configuration providing configurable overbought (70) and oversold (30) levels with middle line (50) reference
- Conditional Color System using performance-based coloring with green for bullish crossovers, red for bearish crossovers, and level-based coloring
🔄 Volume Delta Calculation Engine
- Price Direction Analysis using mathematical sign function to determine positive or negative price movement for volume weighting
- Volume Weighting System multiplying volume by price direction sign for approximated buying versus selling pressure measurement
- Sign Variable Management maintaining price direction state for consistent volume delta calculation across bars
- Null Value Handling ensuring continuous volume delta calculation through proper mathematical validation and error prevention
- Histogram Visualization displaying volume delta as bars with green for buying pressure and red for selling pressure indication
- Independent Display Control allowing users to show or hide volume delta independently of other components for focused analysis
📉 Cumulative Volume Delta (CVD) Framework
- Running Sum Calculation maintaining cumulative total of all volume delta values for long-term order flow trend identification
- Dynamic Color System comparing current CVD with previous bar to determine rising or falling cumulative pressure patterns
- Histogram Style Display presenting CVD as histogram bars for immediate visual impact assessment and trend recognition
- Trend Direction Visualization using green for rising CVD and red for falling CVD with transparency optimization for clarity
- Historical Comparison Logic implementing proper previous bar comparison with null value protection for accurate trend determination
- Independent Activation Control enabling selective CVD display for users focusing on specific aspects of order flow analysis
🎨 Comprehensive Display Control System
- Dual-Mode Visualization enabling toggle between Price Delta display and RSI-of-Delta display for different analytical perspectives
- Grouped Settings Organization separating Price Delta Calculation, RSI Settings, Display Options, and Volume Options for intuitive configuration
- Conditional Plotting Logic displaying components only when specifically enabled to optimize chart performance and visual clarity
- Professional Color Scheme using market-standard colors with appropriate transparency levels for clear visual hierarchy and readability
- Context-Sensitive Reference Lines showing relevant zero lines and RSI levels based on current display mode selection
- Raw RSI Background Display optionally showing unsmoothed RSI values when smoothing is applied for comparison analysis
⚙️ Advanced Moving Average Implementation
- Nine Smoothing Methodologies supporting SMA, EMA, WMA, HMA, RMA, LSMA, DEMA, TEMA, and VIDYA for comprehensive signal processing
- VIDYA Implementation using Variable Index Dynamic Average with volatility-based adaptation for market condition responsiveness
- DEMA and TEMA Calculations implementing Double and Triple Exponential Moving Averages for reduced lag and improved signal quality
- Hull Moving Average Support providing fast and smooth HMA calculations for trend-following applications with minimal lag
- Linear Regression Integration using LSMA for trend-based smoothing with mathematical precision and directional bias
- Fallback Logic Framework ensuring continuous operation when smoothing calculations encounter edge cases or insufficient data
- Dual-Layer Smoothing Architecture enabling independent configuration of primary and secondary smoothing for crossover analysis
📋 Professional Configuration Framework
- Price Delta Calculation Group organizing source selection and period configuration with detailed tooltips for user guidance
- RSI of Price Delta Settings providing comprehensive RSI configuration including period, smoothing options, and level settings
- Display Options Group centralizing visualization controls with clear explanations for mode switching and component selection
- Volume Delta Options Group separating volume-related settings for focused volume analysis configuration and control
- Input Validation Framework ensuring minimum period values and proper parameter selection for reliable calculations
- Tooltip Documentation System offering comprehensive explanations for each setting to guide proper indicator utilization
🔍 Mathematical Implementation Excellence
- Accurate Delta Calculations using proper arithmetic operations for price difference measurement over specified periods with precision
- RSI Mathematical Precision applying standard RSI formulation to delta values with proper gain/loss averaging methodology
- Sign Function Implementation correctly applying mathematical sign determination for price direction analysis and volume weighting
- Volume Multiplication Accuracy precisely weighting volume values by price direction for accurate delta approximation calculations
- Cumulative Sum Precision maintaining accurate running totals using Pine Script's cumulative function with proper initialization
- VIDYA Volatility Calculations implementing proper volatility-based adaptation with mathematical accuracy and edge case handling
- Advanced MA Mathematical Framework ensuring accurate DEMA, TEMA, and other complex moving average calculations
🎯 Market Microstructure Applications
- Order Flow Analysis identifying buying versus selling pressure through volume-weighted price direction assessment and trend analysis
- Momentum-of-Momentum Assessment using RSI-of-delta for identifying acceleration and deceleration in price momentum patterns
- Trend Identification Enhancement leveraging CVD trends to identify long-term accumulation or distribution patterns in market structure
- Volume Profile Integration combining volume data with price direction for comprehensive market microstructure analysis capabilities
- Support/Resistance Validation using delta analysis to confirm or challenge traditional technical analysis levels with order flow context
- Divergence Detection Framework comparing price movement with volume delta and RSI-of-delta patterns for reversal identification
⚡ Performance Optimization Features
- Conditional Plotting Logic displaying only enabled components to optimize chart rendering performance and reduce computational load
- Efficient Variable Management using appropriate variable scoping and initialization for minimal memory usage and optimal processing
- Optimized Color Assignment pre-calculating colors and applying transparency efficiently for smooth visual performance rendering
- Streamlined Calculation Sequences organizing mathematical operations for minimal redundant computation and optimal processing speed
- Dynamic Display Updates providing real-time delta values with immediate visual feedback without compromising performance
- Resource-Conscious Mode Switching activating calculations only when components are displayed to maintain indicator efficiency
🎨 Professional Visualization Framework
- Mode-Specific Color Coding using different color schemes for price delta mode versus RSI-of-delta mode for immediate context recognition
- Transparency Optimization applying appropriate transparency levels for clear visual hierarchy without overwhelming chart information
- Multiple Plot Style Integration implementing line plots for delta/RSI analysis and histogram plots for volume analysis
- Conditional Reference Lines displaying relevant zero lines and RSI levels based on current visualization mode selection
- Background Raw Data Display optionally showing unsmoothed RSI values when smoothing is applied for analytical comparison
- Professional Chart Integration maintaining separate pane layout with proper scaling and formatting for dedicated analysis focus
🔧 Technical Implementation Framework
- Variable Declaration Organization properly declaring color variables and state management variables for clean code structure and maintainability
- Function Library Implementation organizing VIDYA, DEMA, TEMA, and calculateMA functions for modular code architecture
- Calculation Sequence Optimization organizing price delta, RSI-of-delta, volume delta, and CVD calculations in logical processing order
- Plot Management System coordinating multiple plot statements with appropriate conditional logic for efficient rendering
- State Variable Management maintaining sign_price_change and other state variables for consistent calculation across bars
- Error Prevention Architecture incorporating null value checks and mathematical validation for reliable operation under all conditions
✅ Key Takeaways
- Advanced delta analysis framework combining price delta momentum with RSI-of-momentum assessment and volume-weighted directional pressure for comprehensive market microstructure evaluation
- Professional RSI-of-delta implementation with nine advanced smoothing methodologies including VIDYA, DEMA, and TEMA for sophisticated momentum analysis
- Comprehensive volume delta system with CVD tracking and dynamic histogram visualization showing cumulative buying/selling pressure trends over time
- Dual-mode display system enabling seamless switching between price delta visualization and RSI-of-delta analysis for different analytical perspectives
- Mathematical precision implementation using proper delta calculations, RSI formulations, and advanced moving average methodologies with performance optimization
- Professional configuration framework with grouped settings, detailed tooltips, and modular display controls for customized microstructure analysis
- Market applications supporting order flow analysis, momentum acceleration detection, trend identification, and divergence recognition for institutional trading approaches
Script protégé
Ce script est publié en source fermée. Toutefois, vous pouvez l'utiliser librement et sans aucune restriction - en savoir plus ici.
Clause de non-responsabilité
Les informations et les publications ne sont pas destinées à être, et ne constituent pas, des conseils ou des recommandations en matière de finance, d'investissement, de trading ou d'autres types de conseils fournis ou approuvés par TradingView. Pour en savoir plus, consultez les Conditions d'utilisation.