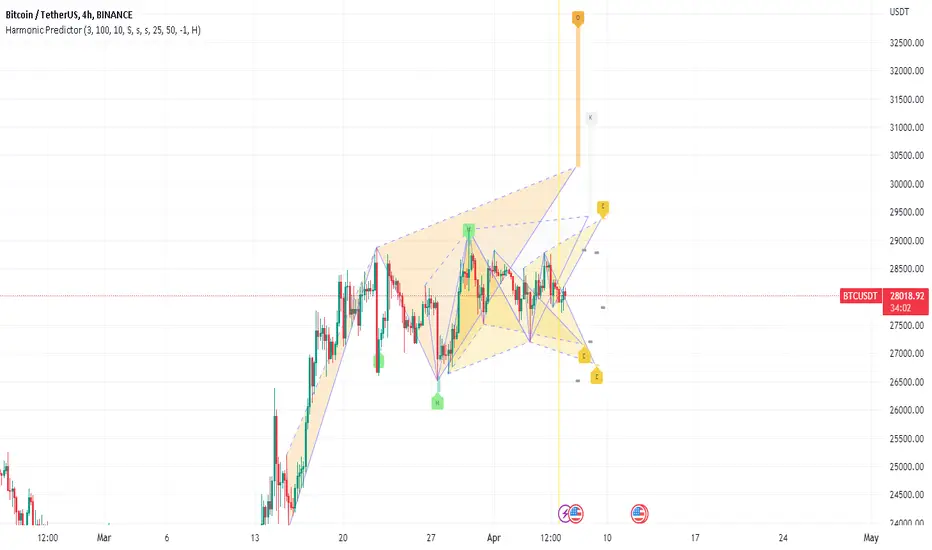
Harmonic Predictor

The Harmonic Predictor is predicting XABCD formations based on XABC chart patterns and simulate trading with price move between points C and D. It's the second way of using harmonic patterns in trading. The script calculates ideal efficiency by entering a position at the C point and exiting either on the stop loss or point D - the take profit value.
Furthermore, you can enable the "relaxed formations" feature to search for generalized variants of the patterns.
This script can be used by any user. There is no need to have a PRO or PREMIUM account.
Harmonic Predictor is just one component of larger "Harmonic" package, which is designed to simplify the use of the ideas proposed by Gartley and to customize them for various financial instruments.
The Harmonic package includes:
⠀⠀Harmonic Scanner - A classic harmonic patterns detector that checks efficiency by entering in D point and trading move to the take profit value.
⠀⠀Harmonic Predictor - A harmonic pattern detector that checks efficiency by entering at the C point and trading the move to the D point.
⠀⠀Harmonic Scanner TakeProfitMap - A supporting script for scanner, that tracks highest potencial profits from historical transactions to better determine the appropriate take profit values for a given financial instrument.
⠀⠀More components is under developement...
If you prefer a video explanation, please refer to the "HowTo: Harmonic Idea" video.
Script with limited access, contact author to get authorization
Script settings:
Extreme area[bars] - Specifies the range in which low/high need to be the lowest/highest bar to be counted as XABCD point.
XA limit [bars] - Specifies the maximum distance between successive points in XABCD formation pattern.
Inaccuracy ‰ - It determines the maximum deviation from the conditions that must be met by the pattern. Larger value will produce more duplicates.
Relaxed formations - Formations marked with * will be relaxed on CBD retracement.
List of formations, each letter enables specific formation.
Visualization section with independent settings for the folowing groups:
- Estimated formations ( high or low are still unconfirmed but their confirmation will add new potencial formation),
- Potencial (formations tracked for statistics)
- Existing
For each group of formations following settings can be customized:
- Color used for drawing formation shape
- Checkbox for enabling/disabling shape visualization
- Checkbox for enabling/disabling target visualization
- Picker for selecting the label type
⠀⠀- h(ide)
⠀⠀- s - Labels with small font
⠀⠀- S - Labels with normal font
StopLoss - Displays stoploss value for potencial and Estiamted formations.
Hide not precised D - It is expected that the price will change direction in D points, but for some potencial formations price is reaching D point area and continue in the same direction. With this option, you can hide these formations.
Transparency settings - Adjust the transparency of formation shapes and targets.
Statistics - Picker for statistics table type:
H(ide) - Hides the statistics table.
P(ositions) - Shows a list of positions with their corresponding stop loss and take profit values. Take profit values that have been reached are highlighted.
% - Displays the efficiency of formations, split by take profit values.
%W - Displays the efficiency of formations, split by take profit values and weighted by formation size.
Position filter - A filter that works with the P(ositions) statistics.
Troubleshooting:
In case of any problems, please send error details to the author of the script.
Script sur invitation seulement
Seuls les utilisateurs approuvés par l'auteur peuvent accéder à ce script. Vous devrez demander et obtenir l'autorisation pour l'utiliser. Celle-ci est généralement accordée après paiement. Pour plus de détails, suivez les instructions de l'auteur ci-dessous ou contactez directement Investor_R.
TradingView ne recommande PAS d'acheter ou d'utiliser un script à moins que vous ne fassiez entièrement confiance à son auteur et que vous compreniez son fonctionnement. Vous pouvez également trouver des alternatives gratuites et open source dans nos scripts communautaires.
Instructions de l'auteur
More details on Website and Youtube.
Clause de non-responsabilité
Script sur invitation seulement
Seuls les utilisateurs approuvés par l'auteur peuvent accéder à ce script. Vous devrez demander et obtenir l'autorisation pour l'utiliser. Celle-ci est généralement accordée après paiement. Pour plus de détails, suivez les instructions de l'auteur ci-dessous ou contactez directement Investor_R.
TradingView ne recommande PAS d'acheter ou d'utiliser un script à moins que vous ne fassiez entièrement confiance à son auteur et que vous compreniez son fonctionnement. Vous pouvez également trouver des alternatives gratuites et open source dans nos scripts communautaires.
Instructions de l'auteur
More details on Website and Youtube.