PROTECTED SOURCE SCRIPT
bakkta`s stochastic
Hey. This is bakkta.
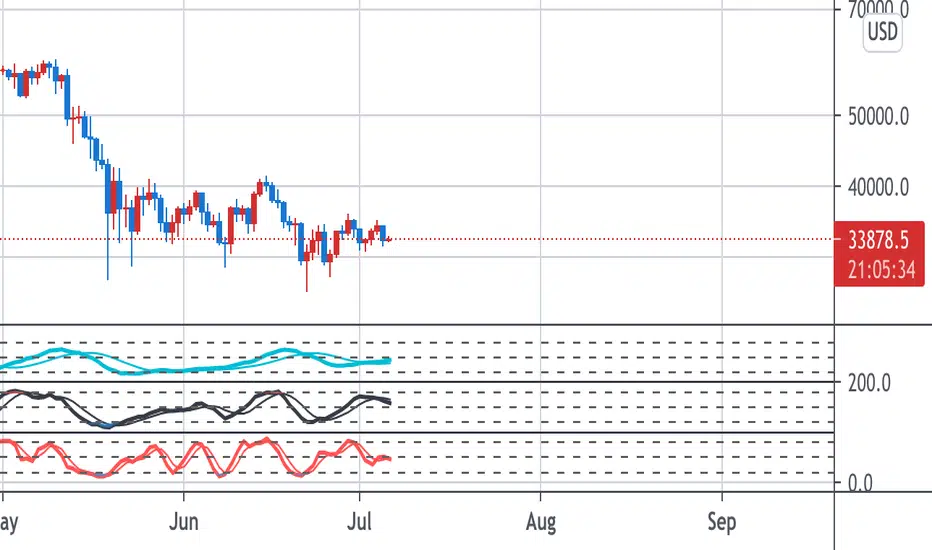
These are three stochastics when I trade. These stochastics` settings are subdivided. So we can predict the next movement if we use the time frame appropriately.
I call them “Big Wave”, “Middle Wave”, “Small Wave” from upper stochastic in order. Each stochastics` color is light blue(B.W.), black(M.W.) and red(S.W.). These colors are the same as the thing of 10M.A., 5M.A. and candle. In other words, When we find the divergences of stochastic, we have to compare B.W. with 10M.A., M.W. with 5M.A. and S.W. with candles.
Big Wave divergence is the most powerful wave and Small Wave divergence is the most weak wave. If we can see the Big wave divergence , It will be possible for the candle to reach a maximum 120M.A.
If the Middle Wave is observed in chart, candle will hit a maximum 60-day moving average. And If the Small Wave is shown us, candle will reach a maximum 20-day moving average. Besides there are a lot of conditions. But It's so complicated and long. So I`ll just shorten the explanation.
This indicator can apply to any market for example stocks, futures, forex, Cfds etc. You don't need to control the setting of this indicator. You can just use because there is only one principle to apply to this.
If you want more information , check my profile. Tha!
Script protégé
Ce script est publié en source fermée. Cependant, vous pouvez l'utiliser librement et sans aucune restriction – pour en savoir plus, cliquez ici.
NO.1 Trading Coach in south korea
Clause de non-responsabilité
Les informations et publications ne sont pas destinées à être, et ne constituent pas, des conseils ou recommandations financiers, d'investissement, de trading ou autres fournis ou approuvés par TradingView. Pour en savoir plus, consultez les Conditions d'utilisation.