PROTECTED SOURCE SCRIPT
Mis à jour Market Profile @joshuuu

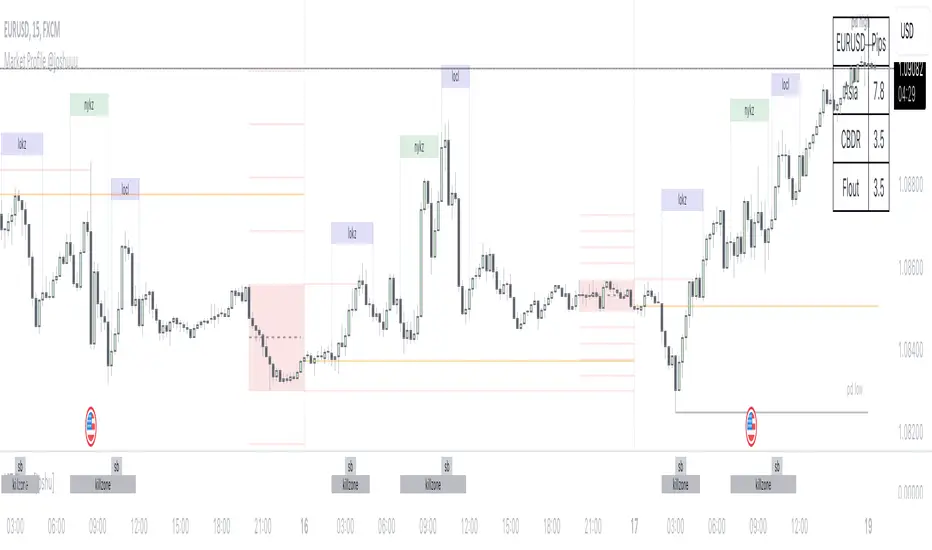
Time is fractal. Every candle has an open, low, high and closing price.
Depending on what timeframe you are on, some opening prices could be more interesting than others.
This indicator tracks, which timeframe you are currently on and displays different things accordingly, so that the chart is never messy.
Below the hourly timeframe, the indicator highlights ICT Killzones, times of the day where most volume occurs and price moves the "cleanest". There are different versions to display those sessions in the settings.
From the hourly timeframe up to the daily timeframe, the indicator shows the "Weekly Profile". It plots the weekly opening line, can highlight daily highs and lows and daily opens and shows the name of the days on the chart.
On the daily timeframe, the indicator switches to a monthly profile. It shows the monthly open, weekly highs/lows AND it shows another concept taught by ICT, the IPDA Lookback.
ICT teaches that especially the last 20, 40 and 60 days PD Arrays and Highs/Lows are important and this indicator highlights those lookback windows accordingly.
The indicator has a lot of settings to make it allow maximum individuality.
Notes de version
fixed daily open on weekly profile for future contractsNotes de version
added "Background" as Killzone Style OptionNotes de version
updated ons session times and added the possibility to display day labels on a timeframe lower than h1. be aware, that day labels always plot at 12Notes de version
added equlibrium, highs and lows to the weekly rangeNotes de version
changed standard settings of the weekly profile to not display daily highs/lows and opens. option is obviously still in the settings, so you can turn em on if you prefer that
Notes de version
added the option to choose the devider colorNotes de version
bug fixNotes de version
added standard deviations, added table that shows pips of Asia, CBDR, FloutNotes de version
limited the asia,cbdr,flout pip numbers to only daily profile (below h1)Notes de version
added lines for previous daily, weekly and monthly high/lowNotes de version
+ added 0.5 Levels to the Standard DeviationsNotes de version
+ added loclNotes de version
-Script protégé
Ce script est publié en source fermée. Cependant, vous pouvez l'utiliser librement et sans aucune restriction – pour en savoir plus, cliquez ici.
Clause de non-responsabilité
Les informations et publications ne sont pas destinées à être, et ne constituent pas, des conseils ou recommandations financiers, d'investissement, de trading ou autres fournis ou approuvés par TradingView. Pour en savoir plus, consultez les Conditions d'utilisation.
Script protégé
Ce script est publié en source fermée. Cependant, vous pouvez l'utiliser librement et sans aucune restriction – pour en savoir plus, cliquez ici.
Clause de non-responsabilité
Les informations et publications ne sont pas destinées à être, et ne constituent pas, des conseils ou recommandations financiers, d'investissement, de trading ou autres fournis ou approuvés par TradingView. Pour en savoir plus, consultez les Conditions d'utilisation.