PROTECTED SOURCE SCRIPT
M2 + Fed Funds con anotaciones históricas
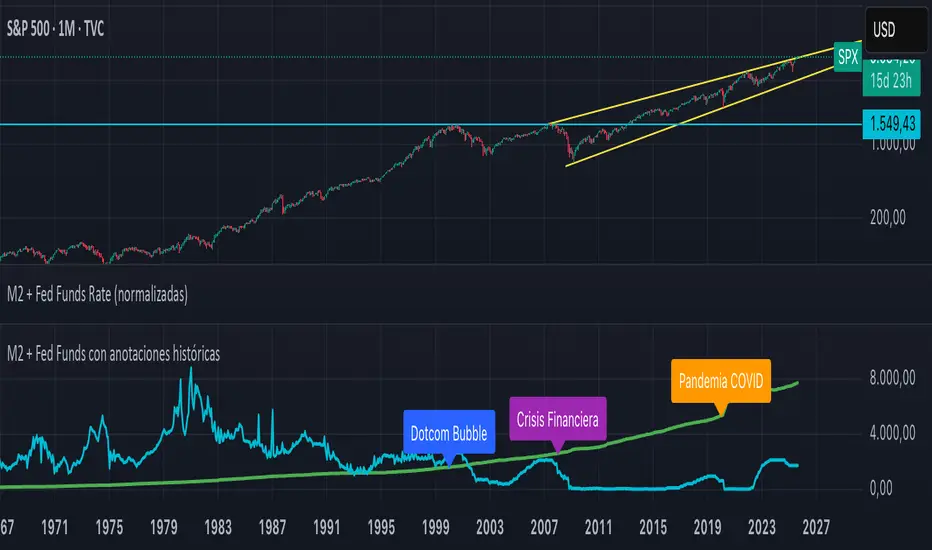
This TradingView indicator creates a separate panel that displays the historical evolution of M2 Money Stock (US) and the Federal Funds Rate, both normalized to a base of 100 for easier comparison. It highlights key historical events with annotations, including:
2000: Dotcom Bubble
2008: Global Financial Crisis
2020: COVID-19 Pandemic
The script allows users to visually analyze the relationship between monetary liquidity (M2) and interest rates, showing how changes in Fed policy correspond to major economic events and trends.
2000: Dotcom Bubble
2008: Global Financial Crisis
2020: COVID-19 Pandemic
The script allows users to visually analyze the relationship between monetary liquidity (M2) and interest rates, showing how changes in Fed policy correspond to major economic events and trends.
Script protégé
Ce script est publié en source fermée. Cependant, vous pouvez l'utiliser librement et sans aucune restriction – pour en savoir plus, cliquez ici.
Clause de non-responsabilité
Les informations et publications ne sont pas destinées à être, et ne constituent pas, des conseils ou recommandations financiers, d'investissement, de trading ou autres fournis ou approuvés par TradingView. Pour en savoir plus, consultez les Conditions d'utilisation.