OPEN-SOURCE SCRIPT
Mis à jour DCA Position vs Cash Holding

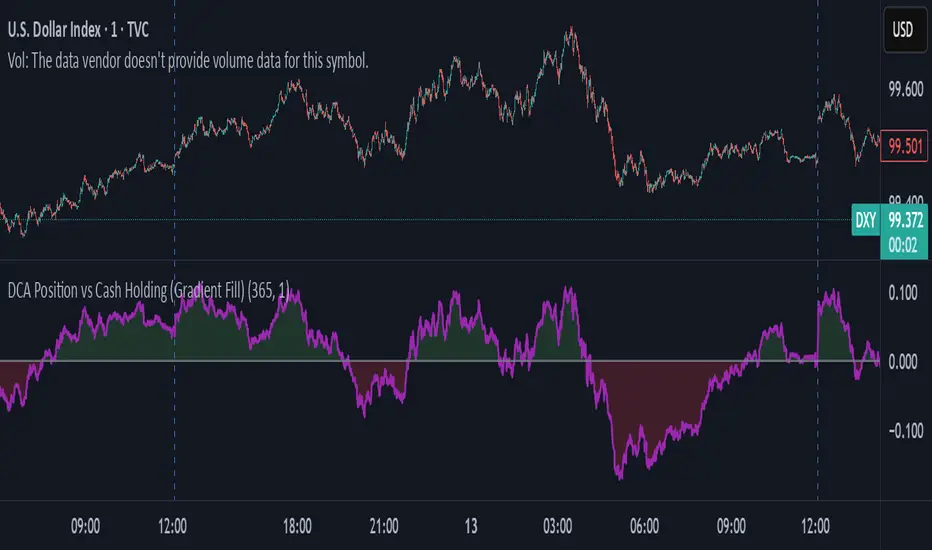
This indicator visualizes the performance of a simulated dollar-cost averaging (DCA) strategy compared to simply holding cash. It models the cumulative position size and value of buying a fixed dollar amount of the asset per candle over a configurable lookback period.
🔍 What It Shows:
Simulates buying $1 (or any amount) of the asset per candle
Tracks the total units accumulated and their current market value
Plots the difference between the DCA position value and total cash spent
Highlights when DCA buyers are underwater — a potential contrarian buy zone
📈 How to Use:
Values above zero indicate DCA outperformance vs cash
Values below zero signal structural drawdown — often a high-conviction bulk-buy opportunity
Use as a sentiment overlay to time discretionary adds or confirm regime shifts
⚙️ Inputs:
Lookback Window: Number of candles used to simulate DCA accumulation
DCA Amount: Dollar value purchased per candle
This tool is ideal for traders seeking to quantify accumulation efficiency, identify cycle inflection points, and visualize sentiment-weighted cost basis dynamics.
Notes de version
Profits as a percentage of cash deployedNotes de version
Shade negative and positive profit regionsScript open-source
Dans l'esprit TradingView, le créateur de ce script l'a rendu open source afin que les traders puissent examiner et vérifier ses fonctionnalités. Bravo à l'auteur! Bien que vous puissiez l'utiliser gratuitement, n'oubliez pas que la republication du code est soumise à nos Règles.
Clause de non-responsabilité
Les informations et publications ne sont pas destinées à être, et ne constituent pas, des conseils ou recommandations financiers, d'investissement, de trading ou autres fournis ou approuvés par TradingView. Pour en savoir plus, consultez les Conditions d'utilisation.
Script open-source
Dans l'esprit TradingView, le créateur de ce script l'a rendu open source afin que les traders puissent examiner et vérifier ses fonctionnalités. Bravo à l'auteur! Bien que vous puissiez l'utiliser gratuitement, n'oubliez pas que la republication du code est soumise à nos Règles.
Clause de non-responsabilité
Les informations et publications ne sont pas destinées à être, et ne constituent pas, des conseils ou recommandations financiers, d'investissement, de trading ou autres fournis ou approuvés par TradingView. Pour en savoir plus, consultez les Conditions d'utilisation.