OPEN-SOURCE SCRIPT
Trend Maestro - Linear Regression & Volatility Bands
Trend Maestro - Linear Regression & Volatility Bands
Description:
The "Trend Maestro - Linear Regression & Volatility Bands" indicator is meticulously designed to provide traders with a clear understanding of market trends through the application of linear regression techniques and enhanced market data visualization. This tool is essential for traders looking to interpret long-term trends and market stability. Here's how the indicator functions and what makes it a unique addition to your trading toolkit:
1. Linear Regression Calculation:
At the heart of this indicator lies the linear regression calculation, which identifies the primary trend direction over a specified period. It does this by computing a line of best fit through the closing prices, helping to smooth out price fluctuations and highlight the prevailing trend direction. Users have the flexibility to adjust both the length of the regression and the offset period, enabling them to tailor the indicator's responsiveness to different market conditions.
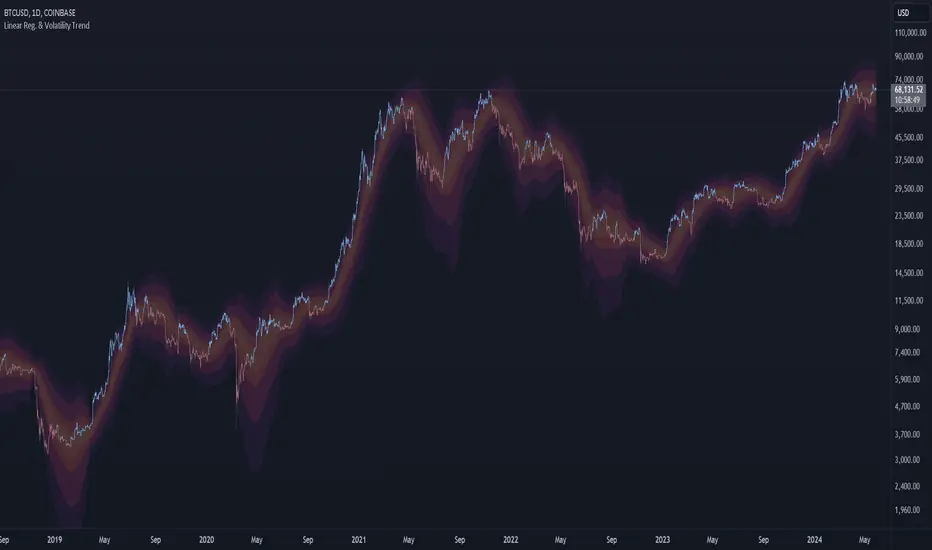
2. Visualization Through Volatility Bands:
The volatility bands, plotted at half, one, two, and three standard deviations around the linear regression line, serve primarily as a visualization tool rather than a basis for investment decisions.
These bands:
Measure the dispersion of price from the trend line, providing a graphical representation of volatility.
Help traders visually assess the market's stability and the reliability of the current trend, with broader bands indicating higher volatility and narrower bands suggesting more stability.
3. Customization Features:
The indicator offers customization options including toggle switches for bar color and the display of SD bands, enhancing visual clarity. These settings allow traders to personalize the display according to their visual preferences and analysis requirements.
By incorporating these elements, the "Trend Maestro - Linear Regression & Volatility Bands" indicator offers a framework for understanding market trends through both quantitative calculations and qualitative visual aids. This makes it a valuable tool for those looking to make informed decisions based on longer-term market observations.
Description:
The "Trend Maestro - Linear Regression & Volatility Bands" indicator is meticulously designed to provide traders with a clear understanding of market trends through the application of linear regression techniques and enhanced market data visualization. This tool is essential for traders looking to interpret long-term trends and market stability. Here's how the indicator functions and what makes it a unique addition to your trading toolkit:
1. Linear Regression Calculation:
At the heart of this indicator lies the linear regression calculation, which identifies the primary trend direction over a specified period. It does this by computing a line of best fit through the closing prices, helping to smooth out price fluctuations and highlight the prevailing trend direction. Users have the flexibility to adjust both the length of the regression and the offset period, enabling them to tailor the indicator's responsiveness to different market conditions.
2. Visualization Through Volatility Bands:
The volatility bands, plotted at half, one, two, and three standard deviations around the linear regression line, serve primarily as a visualization tool rather than a basis for investment decisions.
These bands:
Measure the dispersion of price from the trend line, providing a graphical representation of volatility.
Help traders visually assess the market's stability and the reliability of the current trend, with broader bands indicating higher volatility and narrower bands suggesting more stability.
3. Customization Features:
The indicator offers customization options including toggle switches for bar color and the display of SD bands, enhancing visual clarity. These settings allow traders to personalize the display according to their visual preferences and analysis requirements.
By incorporating these elements, the "Trend Maestro - Linear Regression & Volatility Bands" indicator offers a framework for understanding market trends through both quantitative calculations and qualitative visual aids. This makes it a valuable tool for those looking to make informed decisions based on longer-term market observations.
Script open-source
Dans l'esprit TradingView, le créateur de ce script l'a rendu open source afin que les traders puissent examiner et vérifier ses fonctionnalités. Bravo à l'auteur! Bien que vous puissiez l'utiliser gratuitement, n'oubliez pas que la republication du code est soumise à nos Règles.
Clause de non-responsabilité
Les informations et publications ne sont pas destinées à être, et ne constituent pas, des conseils ou recommandations financiers, d'investissement, de trading ou autres fournis ou approuvés par TradingView. Pour en savoir plus, consultez les Conditions d'utilisation.