BORCv5: Breakout Reversal, Standard Deviation & Bollinger Bands
The BORCv5 (Breakout Reversal Confirmation) script can improve your trading by visualizing the standard deviation lines & bollinger bands on your chart, along with breakout reversal early warning and confirmation signals which can be interpreted as buy/sell signals.
- BORCv5 utilizes multi-period Bollinger Bands & custom signals to paint a clear picture of price movement.
- BORCv5 works on everything: Futures, Equities, Indices, Crypto, and on any time interval.
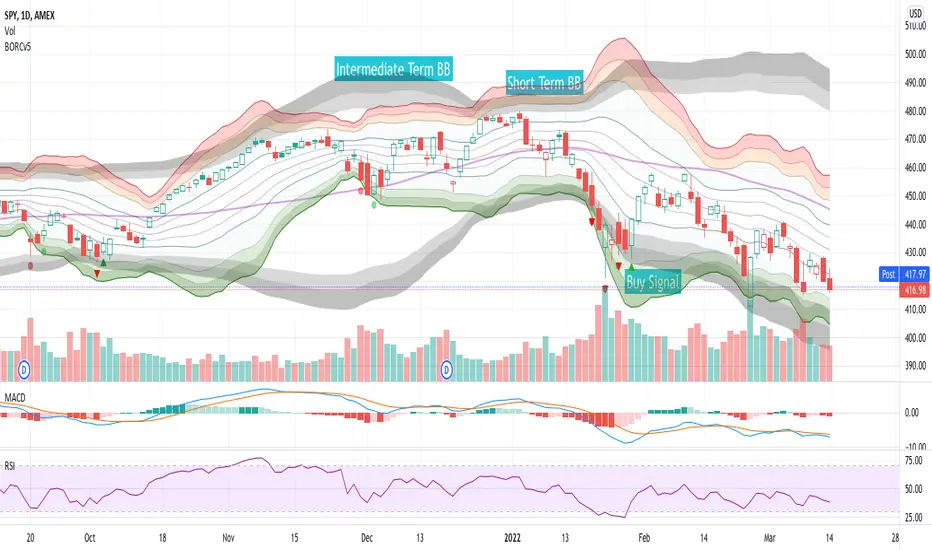
The purple line represents the simple moving average (SMA) for the period (default: 20). You can use the EMA instead if you prefer via settings.
The Bollinger bands & trend lines tell you if the stock is trading "high" or "low" relative to its recent price action.
- The inner green/orange/red bands represent short term Bollinger Bands: 1 Standard Deviation (SD), 2SD, 3SD and 4SD
- The grey bands represent intermediate term Bollinger Bands.
The width of the bands changes due to volatility. Narrow Bollinger Bands represent low volatility, where price is relatively flat or trending slowly in one direction. Wide open Bollinger Bands signify either high volatility OR trending powerfully in one direction. If the Bands are pointing downwards it is a bearish trend and if the Bands are pointing upwards it is a bullish trend.
It is important to get the right amount of data (or context) for Bollinger Bands: Too small of a period for basis (5,8,10) and you won't have enough data (or context). Too high of a period and you will have too much data (or context). The right amount of data (or context) is also important because you want to follow averages that algos & other traders follow and you want the Bollinger length to give you enough data to see various standard deviations. Too low of a Bollinger length means the bands deform too easy & too high of a Bollinger length means they are too flat, making the data hard to interpret. We like 20 periods as a compromise between not enough & too much data but you can adjust this value in the script settings.
Breakout Reversal Confirmation Signals:
Pay attention to the triangles: they represent the price movement action of the larger period Bollinger Band that will filter out most of the false breakouts.
Triangles pop up when the price breaches the 2.9 standard deviation, meaning we're in an extreme range leading to a continuation or reversal.
Red Triangle:
- Pointing Down => Bearish Breakout has occurred, watch for a Bullish Reversal
- Pointing Up => Bullish Breakout has occurred, watch for a Bearish Reversal
Green Triangle:
- Pointing Down => Bearish Reversal is confirmed, price has a high chance to move Bearish
- Pointing Up => Bullish Reversal is confirmed, price has a high chance to move Bullish
Red Circle:
- Weak Bearish / Bullish Breakout
Green Circle:
- Weak Bearish / Bullish Reversal Confirmed
For more information, see the BORC PDF guide and examples!
PS: This script was originally published by reaganmcf and has been upgraded to Pine v5.
Script sur invitation seulement
Seuls les utilisateurs approuvés par l'auteur peuvent accéder à ce script. Vous devrez demander et obtenir l'autorisation pour l'utiliser. Celle-ci est généralement accordée après paiement. Pour plus de détails, suivez les instructions de l'auteur ci-dessous ou contactez directement philamerica.
TradingView ne recommande PAS de payer ou d'utiliser un script à moins que vous ne fassiez entièrement confiance à son auteur et que vous compreniez comment il fonctionne. Vous pouvez également trouver des alternatives gratuites et open-source dans nos scripts communautaires.
Instructions de l'auteur
Clause de non-responsabilité
Script sur invitation seulement
Seuls les utilisateurs approuvés par l'auteur peuvent accéder à ce script. Vous devrez demander et obtenir l'autorisation pour l'utiliser. Celle-ci est généralement accordée après paiement. Pour plus de détails, suivez les instructions de l'auteur ci-dessous ou contactez directement philamerica.
TradingView ne recommande PAS de payer ou d'utiliser un script à moins que vous ne fassiez entièrement confiance à son auteur et que vous compreniez comment il fonctionne. Vous pouvez également trouver des alternatives gratuites et open-source dans nos scripts communautaires.