OPEN-SOURCE SCRIPT
RSI and MACD Crossover Signals
Best for Short-Term/Intraday Trading on SPY, TSLA, NVDA
Strategy Concept:
This strategy is designed for short-term trading across various assets and timeframes (Recommend: 1min, 5min, 15min, 1hr, 4hr, 1day). It leverages the Relative Strength Index (RSI) and Moving Average Convergence Divergence (MACD) to identify potential buy and sell signals. The strategy aims to capture moments where the asset's price is likely to experience a reversal or a significant momentum shift.
By combining the RSI and MACD indicators, the strategy seeks to increase the accuracy of identifying potential trend reversals or continuations, taking into account both the momentum and the trend direction of the asset.
RSI (Relative Strength Index) Parameters:
MACD (Moving Average Convergence Divergence) Parameters:
Signal Generation Logic:
Buy Signal:
Sell Signal:
Additional Features:
The script includes a notification system that alerts the trader when either a buy or sell signal is detected. The alert signal is combined with both the buy and sell signal in 1 so people without premium can be alerted when any signal appears.
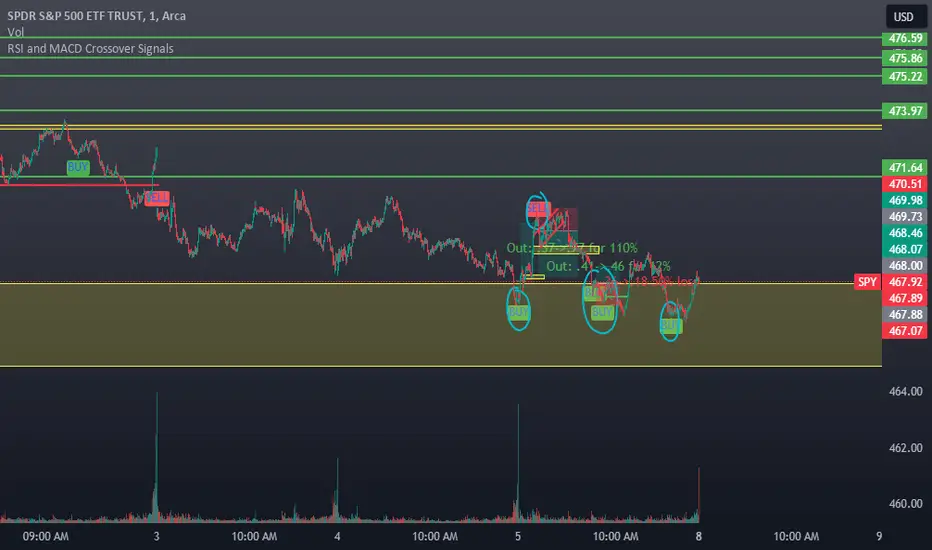
Buy signals are visually represented on the chart below the price bars with a green "BUY" label.
Sell signals are indicated above the price bars with a red "SELL" label.
Usage and Application:
This strategy is versatile and recommended to be played with scalps and day trades. I prefer SPY 0DTE on the 1 and 5 minute timeframe and looking for bigger trend reversals on the 1hr, 4hr, and 1 day timeframe.
Strategy Concept:
This strategy is designed for short-term trading across various assets and timeframes (Recommend: 1min, 5min, 15min, 1hr, 4hr, 1day). It leverages the Relative Strength Index (RSI) and Moving Average Convergence Divergence (MACD) to identify potential buy and sell signals. The strategy aims to capture moments where the asset's price is likely to experience a reversal or a significant momentum shift.
By combining the RSI and MACD indicators, the strategy seeks to increase the accuracy of identifying potential trend reversals or continuations, taking into account both the momentum and the trend direction of the asset.
RSI (Relative Strength Index) Parameters:
- The RSI period is set to 14
- Overbought and oversold levels are set at 70 and 30, respectively
- The RSI is used to identify potential reversal points when the asset is overbought or oversold
MACD (Moving Average Convergence Divergence) Parameters:
- The MACD settings are configured with a fast length of 8, a slow length of 34, and a signal smoothing of 8
- The MACD line crossing over or under the signal line is used to confirm the potential buy or sell signals indicated by the RSI
Signal Generation Logic:
Buy Signal:
- Triggered when the RSI crosses above the oversold level (30).
- Confirmed if the MACD line crosses above the signal line within a delay period of up to 4 candles after the RSI signal.
Sell Signal:
- Triggered when the RSI crosses below the overbought level (70).
- Confirmed if the MACD line crosses below the signal line within a delay period of up to 4 candles after the RSI signal.
Additional Features:
The script includes a notification system that alerts the trader when either a buy or sell signal is detected. The alert signal is combined with both the buy and sell signal in 1 so people without premium can be alerted when any signal appears.
Buy signals are visually represented on the chart below the price bars with a green "BUY" label.
Sell signals are indicated above the price bars with a red "SELL" label.
Usage and Application:
This strategy is versatile and recommended to be played with scalps and day trades. I prefer SPY 0DTE on the 1 and 5 minute timeframe and looking for bigger trend reversals on the 1hr, 4hr, and 1 day timeframe.
Script open-source
Dans l'esprit TradingView, le créateur de ce script l'a rendu open source afin que les traders puissent examiner et vérifier ses fonctionnalités. Bravo à l'auteur! Bien que vous puissiez l'utiliser gratuitement, n'oubliez pas que la republication du code est soumise à nos Règles.
Clause de non-responsabilité
Les informations et publications ne sont pas destinées à être, et ne constituent pas, des conseils ou recommandations financiers, d'investissement, de trading ou autres fournis ou approuvés par TradingView. Pour en savoir plus, consultez les Conditions d'utilisation.