OPEN-SOURCE SCRIPT
Mis à jour Fibonacci Ghost Cloud

Hello my nocturnal minions.... This is your dark knight in the crypto light.... your alpha and omega, your crypto king reigning wisdom down from my gilded throne of code!
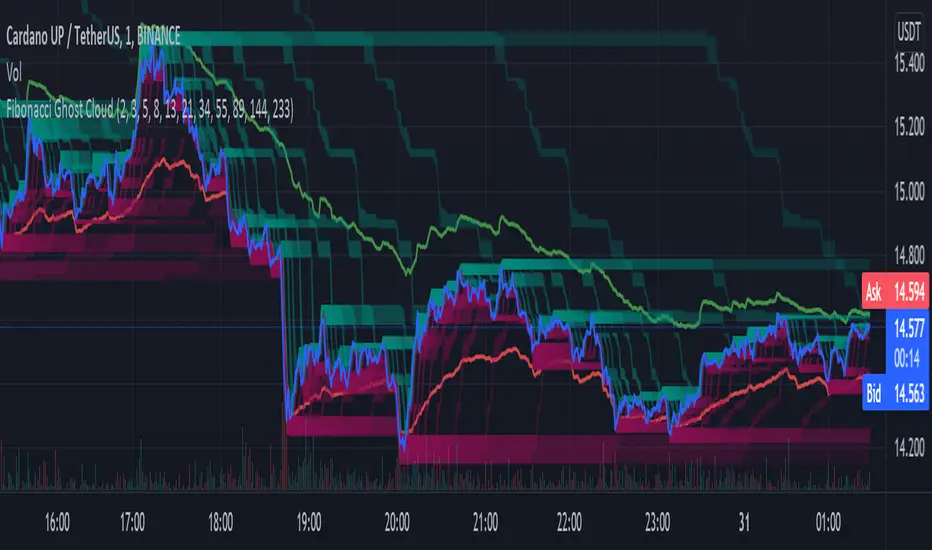
Enjoy the spooky Fibonacci Ghost Cloud. Shadows of previous Fibonacci look-back levels provide possible entries, stop losses, and take profit levels for intrepid crypto travelers.
DESCRIPTION
This indicator is front weighted by using the Fibonacci integer sequence..... 2,3,5,8,13. Each green and red "ghost" is a reflection of the highest highs and lowest lows of a given FIB lookback. The guide lines, red and green, are averages of the highs (green) and the lows (red).
USAGE
The "ghosts" can be used as possible support and resistance levels. They diminish in intensity (they become more transparent) as these ghosts move back further in time. When multiple greens overlap it is an indicator of a lot of recent price action at that level. The same is true of overlapping red.
In addition, the amount of ghosts above and/or below are indicative of recent price action taking place at a higher or a lower level
CURRENT PRICE IS LOWER THAN RECENT PA - There will be many green ghosts above, but few or no red ghosts below.
CURRENT PRICE IS HIGHER THAN RECENT PA- There will be many red ghosts below, but few or no green above
TAKE PROFIT - Possible take profit targets could be on the approach to a previous green level
STOP LOSS - Possible stop losses could be at lower red level
Like Bollinger bands, the green and red "average" lines can help to indicate that a security is oversold or underbought according to how close it is to a recent average. Nearing the red line can indicate that the security is oversold - and the converse is also true.
DERIVATIONS
Within the code is additional greyed-out lines which could be activated allowing you to target the open or close, instead of the High-Low - the current settings
SETTINGS:
You can change the FIB levels and substitute your own integer sequence to use as the lookback.
Feel free to offer feedback and/or suggest features you would like to have added.
Notes de version
Repairing a small labeling problem that I overlooked in V1Script open-source
Dans l'esprit TradingView, le créateur de ce script l'a rendu open source afin que les traders puissent examiner et vérifier ses fonctionnalités. Bravo à l'auteur! Bien que vous puissiez l'utiliser gratuitement, n'oubliez pas que la republication du code est soumise à nos Règles.
Clause de non-responsabilité
Les informations et publications ne sont pas destinées à être, et ne constituent pas, des conseils ou recommandations financiers, d'investissement, de trading ou autres fournis ou approuvés par TradingView. Pour en savoir plus, consultez les Conditions d'utilisation.
Script open-source
Dans l'esprit TradingView, le créateur de ce script l'a rendu open source afin que les traders puissent examiner et vérifier ses fonctionnalités. Bravo à l'auteur! Bien que vous puissiez l'utiliser gratuitement, n'oubliez pas que la republication du code est soumise à nos Règles.
Clause de non-responsabilité
Les informations et publications ne sont pas destinées à être, et ne constituent pas, des conseils ou recommandations financiers, d'investissement, de trading ou autres fournis ou approuvés par TradingView. Pour en savoir plus, consultez les Conditions d'utilisation.