PROTECTED SOURCE SCRIPT
Mis à jour Buy/Sell Volume Details
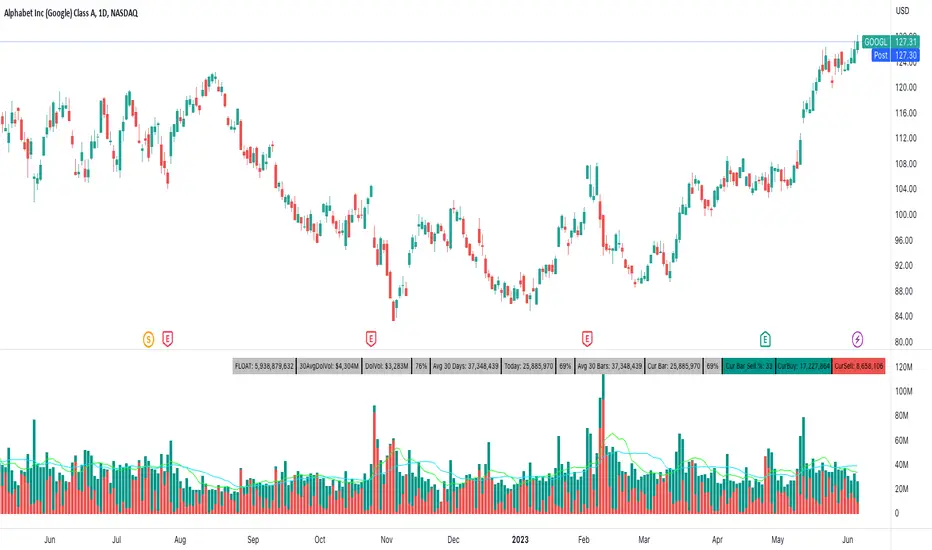
This attempts to color buy and sell volume of each bar.
In addition to coloring the bars, the table shows average volumes for the past 30 days, current volume for the day, current bar volume, the float of the ticker, and dollar volume for the day and average 30 days. You can also plot a fast and slow moving average of volume.
In addition to coloring the bars, the table shows average volumes for the past 30 days, current volume for the day, current bar volume, the float of the ticker, and dollar volume for the day and average 30 days. You can also plot a fast and slow moving average of volume.
Notes de version
- Enhanced the code to be. more efficient when calculating the averages
- Added the ability to select the look back period. The default is 30 days but you can now change how far back you want the averages to take into account.
Notes de version
- Added buy and sell volume cells that can be toggled on/off
Script protégé
Ce script est publié en source fermée. Cependant, vous pouvez l'utiliser librement et sans aucune restriction – pour en savoir plus, cliquez ici.
Clause de non-responsabilité
Les informations et publications ne sont pas destinées à être, et ne constituent pas, des conseils ou recommandations financiers, d'investissement, de trading ou autres fournis ou approuvés par TradingView. Pour en savoir plus, consultez les Conditions d'utilisation.