OPEN-SOURCE SCRIPT
UCS_Transactional Valuation Index-Version 2
Version 1 - tradingview.com/v/BRrxp5vv/
Updates include
Better Optimization on the levels.
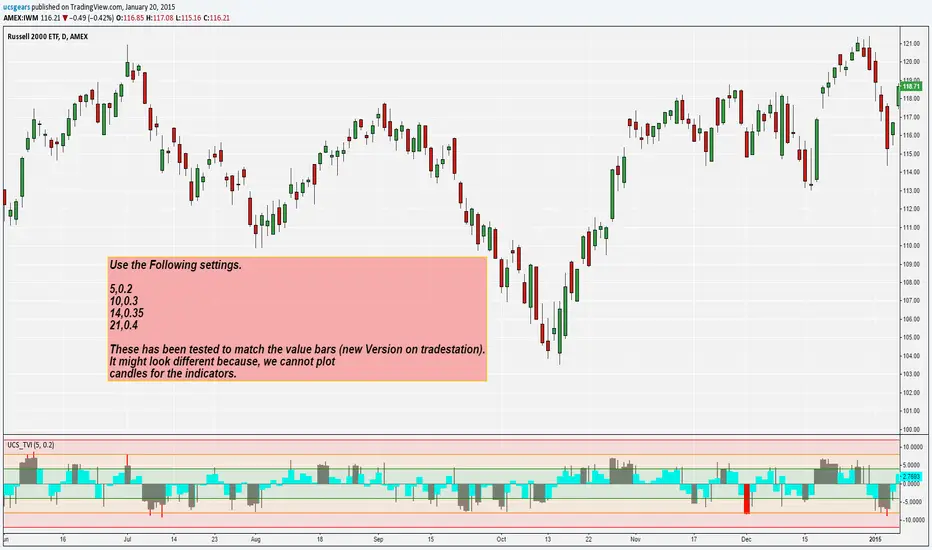
Plotting only the important Highs and Lows
The extremes can be an important pivot levels.
Over and Undervalue - Gray (Column - close) (Histogram - High/Low)
Extreme conditions - Red
Extreme Alerts and Overlay will be added later.
Updates include
Better Optimization on the levels.
Plotting only the important Highs and Lows
The extremes can be an important pivot levels.
Over and Undervalue - Gray (Column - close) (Histogram - High/Low)
Extreme conditions - Red
Extreme Alerts and Overlay will be added later.
Script open-source
Dans l'esprit de TradingView, le créateur de ce script l'a rendu open-source, afin que les traders puissent examiner et vérifier sa fonctionnalité. Bravo à l'auteur! Vous pouvez l'utiliser gratuitement, mais n'oubliez pas que la republication du code est soumise à nos Règles.
Uday C Santhakumar
Clause de non-responsabilité
Les informations et les publications ne sont pas destinées à être, et ne constituent pas, des conseils ou des recommandations en matière de finance, d'investissement, de trading ou d'autres types de conseils fournis ou approuvés par TradingView. Pour en savoir plus, consultez les Conditions d'utilisation.