INVITE-ONLY SCRIPT
[MAD] Support / Resistance

Support/Resistance - Multi-Timeframe Data Plotter
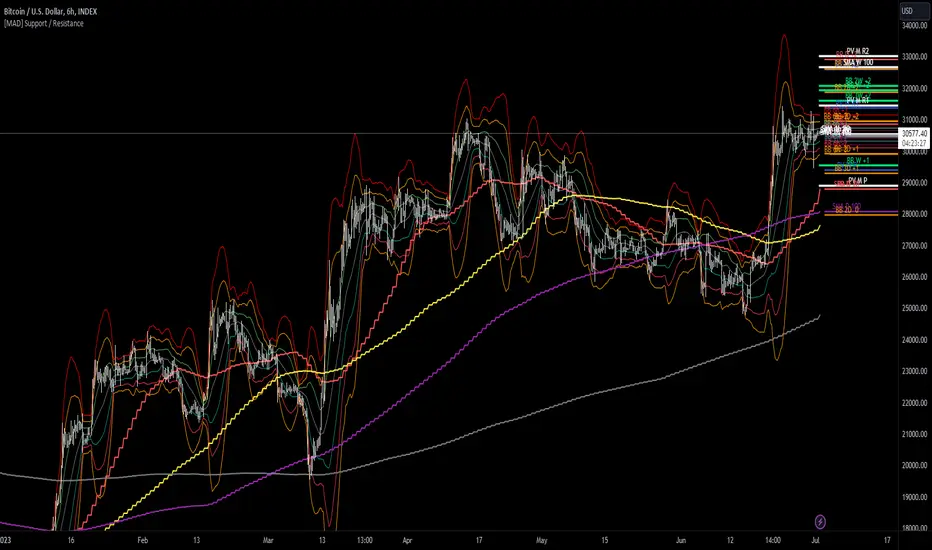
This Pine Script indicator provides users with the ability to analyze various technical indicators, including Bollinger Bands, Simple Moving Averages (SMA), Exponential Moving Averages (EMA), and Pivot Points, across different timeframes. It visually represents these indicators on the chart, allowing for comprehensive analysis.
Key Features:
Bollinger Bands: The indicator supports 6 different timeframes for Bollinger Bands. Users can customize the length of the Bollinger Bands for each timeframe and choose whether to display levels and plots.
Simple Moving Averages (SMA): The indicator supports 4 different timeframes for SMAs. Users can define custom lengths for the SMAs and choose which ones to display on the chart or in the S/R Screen.
Exponential Moving Averages (EMA): Similar to SMAs, the indicator supports 4 different timeframes for EMAs. Users can define custom lengths for the EMAs and choose which ones to display on the chart or in the S/R Screen.
Pivot Points: The indicator supports 4 different timeframes for Pivot Points. Users can choose between Traditional and Fibonacci calculation methods and customize the appearance of the pivot levels.
Global Switches: Users have the option to enable or disable the display of pivots, Bollinger Bands, SMAs, EMAs, open/close/high/low values, horizon plot, and VPR-style plot (weighted Gaussian addition).
Plot Limitation: Users can limit the plotting of support and resistance lines by specifying a percentage up/down.
This indicator offers extensive customization and flexibility, allowing users to analyze the market using these technical indicators across multiple timeframes.
Please refer to this screenshot for an overview of all available settings:

Additionally, the indicator includes a multiplot-chartselect feature to address the limitation of 32 data streams with colors. This feature enables the selection of 10 SMAs or EMAs from different timeframes, along with 3 timeframes of Bollinger Bands and the daily open/close values, all in a single packed indicator. Here is an example of how the data can be displayed:

Enabling all features simultaneously may result in visual overload. However, for users who wish to view specific indicators, this indicator provides all the necessary options. Please refer to this screenshot for an example of various indicators displayed:

To enhance visibility, all lines are weighted, and line and label positions can be dynamically shifted based on these weights.
This Pine Script indicator provides users with the ability to analyze various technical indicators, including Bollinger Bands, Simple Moving Averages (SMA), Exponential Moving Averages (EMA), and Pivot Points, across different timeframes. It visually represents these indicators on the chart, allowing for comprehensive analysis.
Key Features:
Bollinger Bands: The indicator supports 6 different timeframes for Bollinger Bands. Users can customize the length of the Bollinger Bands for each timeframe and choose whether to display levels and plots.
Simple Moving Averages (SMA): The indicator supports 4 different timeframes for SMAs. Users can define custom lengths for the SMAs and choose which ones to display on the chart or in the S/R Screen.
Exponential Moving Averages (EMA): Similar to SMAs, the indicator supports 4 different timeframes for EMAs. Users can define custom lengths for the EMAs and choose which ones to display on the chart or in the S/R Screen.
Pivot Points: The indicator supports 4 different timeframes for Pivot Points. Users can choose between Traditional and Fibonacci calculation methods and customize the appearance of the pivot levels.
Global Switches: Users have the option to enable or disable the display of pivots, Bollinger Bands, SMAs, EMAs, open/close/high/low values, horizon plot, and VPR-style plot (weighted Gaussian addition).
Plot Limitation: Users can limit the plotting of support and resistance lines by specifying a percentage up/down.
This indicator offers extensive customization and flexibility, allowing users to analyze the market using these technical indicators across multiple timeframes.
Please refer to this screenshot for an overview of all available settings:
Additionally, the indicator includes a multiplot-chartselect feature to address the limitation of 32 data streams with colors. This feature enables the selection of 10 SMAs or EMAs from different timeframes, along with 3 timeframes of Bollinger Bands and the daily open/close values, all in a single packed indicator. Here is an example of how the data can be displayed:
Enabling all features simultaneously may result in visual overload. However, for users who wish to view specific indicators, this indicator provides all the necessary options. Please refer to this screenshot for an example of various indicators displayed:
To enhance visibility, all lines are weighted, and line and label positions can be dynamically shifted based on these weights.
Script sur invitation seulement
L'accès à ce script est limité aux utilisateurs autorisés par l'auteur et nécessite généralement un paiement. Vous pouvez l'ajouter à vos favoris, mais vous ne pourrez l'utiliser qu'après avoir demandé et obtenu l'autorisation de son auteur. Contactez djmad pour plus d'informations, ou suivez les instructions de l'auteur ci-dessous.
TradingView ne suggère pas de payer pour un script et de l'utiliser à moins que vous ne fassiez confiance à 100% à son auteur et que vous compreniez comment le script fonctionne. Dans de nombreux cas, vous pouvez trouver une bonne alternative open-source gratuite dans nos Scripts communautaires.
Instructions de l'auteur
″To get this indicator visit my Bio-Link
Vous voulez utiliser ce script sur un graphique ?
Avertissement: veuillez lire avant de demander l'accès.
djmad|Bitblockart
Clause de non-responsabilité
Les informations et les publications ne sont pas destinées à être, et ne constituent pas, des conseils ou des recommandations en matière de finance, d'investissement, de trading ou d'autres types de conseils fournis ou approuvés par TradingView. Pour en savoir plus, consultez les Conditions d'utilisation.