Order Flow Footprint Real-time
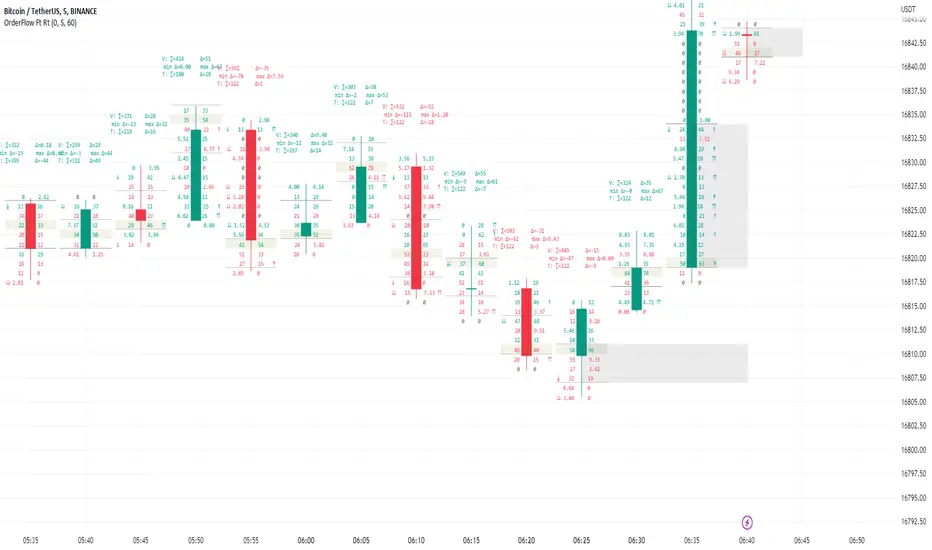
Values on left side of a candle are bids - Transactions done by active sellers with passive buyers.
Values on right side of a candle are asks - Transactions done by active buyers with passive sellers.
This script is a part of a toolkit called "Order Flow":
Order Flow Register - Register showing list of recently done transactions with clasification on bids and asks.
Order Flow Footprint Realtime - Tool showing bid and ask structure of transactions inside realtime candles.
Order Flow Footprint Estimation - Tool showing estimated bid and ask structure based on historical data.
This tool requires frequently updated real-time data to work efficiently. It cannot analyze historic charts. If you need footprint of historic data just use Order Flow Footprint Estimation instead.
Warning !
TradingView has a data delay feature on many exchanges (10-30 minutes) and real-time data are extra paid in that case. Missing real-time data source will limit the functionality of the script to educational purposes only.
User Interface:
Script is drawing volume values grouped into price slots. Price slots height is controled by slot height param in settings.
Volume values are clasified as bids and asks and draw on opposite sides of a candle. On left side of a candle bid volume values are shown and on right side ask volume values are shown.
Before bid values may appear symbols of sellers aggressiveness compared with buyers:
↓ - 3 times
↡ - 5 times
⇊ - 10 times
After ask values may appear symbol of buyers aggressiveness compared with sellers:
↑ - 3 time
↟ - 5 times
⇈ - 10 times
Above the candle we have some statistics of that candle:
"V:" - Row with volume statistics: ∑ - Total volume, Δ - Difference between asks and bids (typically negative in down trend and positive in up trend). Below the smallest and largest delta values recorded during this candle.
"T:" - Row with transaction estimations: ∑ - Estimation of total transactions, Δ - Difference between number of ask and bid transaction estimations
Script settings:
Slot height = 10^ - Price slot height on the chart:
0 - 1$
1 = 10$
2 = 100$
3 = 1000$
-1 = 0.1$
-2 = 0.01$
-3 = 0.001$
Font size - Font size used to draw all the data over the chart: Tiny, Small, Normal, Large
Centered - If checked volume labels are stick to candle
Draw bars - Option of drawing candles fiting to volume labels and 2 fields for picking colors of up and down candles.
Underline biggest slot - Option to underline price slot with biggest volume in the candle.
Color values - Option to draw labels with use of Ask and Bid colors, depending on which value is bigger in the price slot.
Troubleshooting:
In case of any problems, please send error details to the author of the script.
Highlight biggest slot - Option to highlight price slot with biggest volume in the candle with picked color.
Show candle core – Option to mark group of slots with biggest volume having at least n (20-90)% of candle volume. Group will be marked with picked color.
Show warnings – Flag enabling/disabling warning messages (e.g. incorrect precision). If warnings are disabled only errors will appear in the dialog.
Script sur invitation seulement
Seuls les utilisateurs approuvés par l'auteur peuvent accéder à ce script. Vous devrez demander et obtenir l'autorisation pour l'utiliser. Celle-ci est généralement accordée après paiement. Pour plus de détails, suivez les instructions de l'auteur ci-dessous ou contactez directement Investor_R.
TradingView ne recommande PAS d'acheter ou d'utiliser un script à moins que vous ne fassiez entièrement confiance à son auteur et que vous compreniez son fonctionnement. Vous pouvez également trouver des alternatives gratuites et open source dans nos scripts communautaires.
Instructions de l'auteur
More details on Website and Youtube.
Clause de non-responsabilité
Script sur invitation seulement
Seuls les utilisateurs approuvés par l'auteur peuvent accéder à ce script. Vous devrez demander et obtenir l'autorisation pour l'utiliser. Celle-ci est généralement accordée après paiement. Pour plus de détails, suivez les instructions de l'auteur ci-dessous ou contactez directement Investor_R.
TradingView ne recommande PAS d'acheter ou d'utiliser un script à moins que vous ne fassiez entièrement confiance à son auteur et que vous compreniez son fonctionnement. Vous pouvez également trouver des alternatives gratuites et open source dans nos scripts communautaires.
Instructions de l'auteur
More details on Website and Youtube.