OPEN-SOURCE SCRIPT
Mis à jour RSI+ Overbought/Sold Indicator

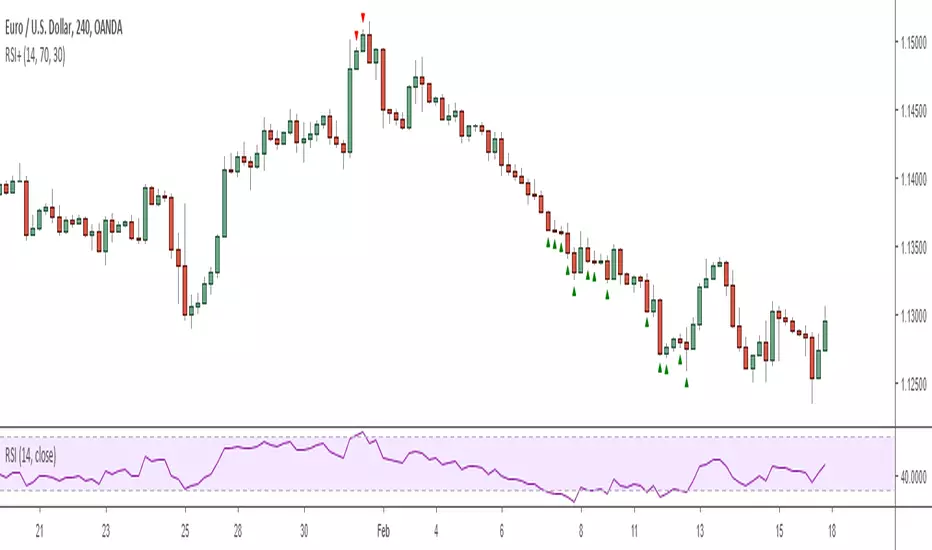
This is a very simple script that plots signals on the chart whenever the RSI crosses the given threshold. Nothing fancy, but it is useful for deciding when to exit trades or prepare for pullbacks or for confirming that the market is currently in the middle of an extremely impulsive move or trend. It has alert functionality and you can set the overbought/sold thresholds and RSI length in the options menu.
Note: I definitely wouldn't recommend using it to enter trades unless you're an experienced counter-trend trader :)
Regards -
Matt.
Note: I definitely wouldn't recommend using it to enter trades unless you're an experienced counter-trend trader :)
Regards -
Matt.
Notes de version
Removed text labels to make indicator more subtle. Very useful as a background confirmation tool against support & resistance for counter-trend opportunities or for gauging momentum during over-extended pullbacks for trend-continuation opportunities.Notes de version
-Notes de version
Minor improvementsNotes de version
Updated to Pine Script v5Script open-source
Dans l'esprit TradingView, le créateur de ce script l'a rendu open source afin que les traders puissent examiner et vérifier ses fonctionnalités. Bravo à l'auteur! Bien que vous puissiez l'utiliser gratuitement, n'oubliez pas que la republication du code est soumise à nos Règles.
My Resources Hub: theartoftrading.com
FREE YouTube Lessons: rebrand.ly/zyt
FREE Pine Script Basics Course: rebrand.ly/zpsbc
Pine Script MASTERY Course: rebrand.ly/zpsmc
My Indicators & Strategies: rebrand.ly/zmisc
FREE YouTube Lessons: rebrand.ly/zyt
FREE Pine Script Basics Course: rebrand.ly/zpsbc
Pine Script MASTERY Course: rebrand.ly/zpsmc
My Indicators & Strategies: rebrand.ly/zmisc
Clause de non-responsabilité
Les informations et publications ne sont pas destinées à être, et ne constituent pas, des conseils ou recommandations financiers, d'investissement, de trading ou autres fournis ou approuvés par TradingView. Pour en savoir plus, consultez les Conditions d'utilisation.
Script open-source
Dans l'esprit TradingView, le créateur de ce script l'a rendu open source afin que les traders puissent examiner et vérifier ses fonctionnalités. Bravo à l'auteur! Bien que vous puissiez l'utiliser gratuitement, n'oubliez pas que la republication du code est soumise à nos Règles.
My Resources Hub: theartoftrading.com
FREE YouTube Lessons: rebrand.ly/zyt
FREE Pine Script Basics Course: rebrand.ly/zpsbc
Pine Script MASTERY Course: rebrand.ly/zpsmc
My Indicators & Strategies: rebrand.ly/zmisc
FREE YouTube Lessons: rebrand.ly/zyt
FREE Pine Script Basics Course: rebrand.ly/zpsbc
Pine Script MASTERY Course: rebrand.ly/zpsmc
My Indicators & Strategies: rebrand.ly/zmisc
Clause de non-responsabilité
Les informations et publications ne sont pas destinées à être, et ne constituent pas, des conseils ou recommandations financiers, d'investissement, de trading ou autres fournis ou approuvés par TradingView. Pour en savoir plus, consultez les Conditions d'utilisation.