OPEN-SOURCE SCRIPT
Mis à jour Cash Flow Yields
Cash Flow Yields Indicator
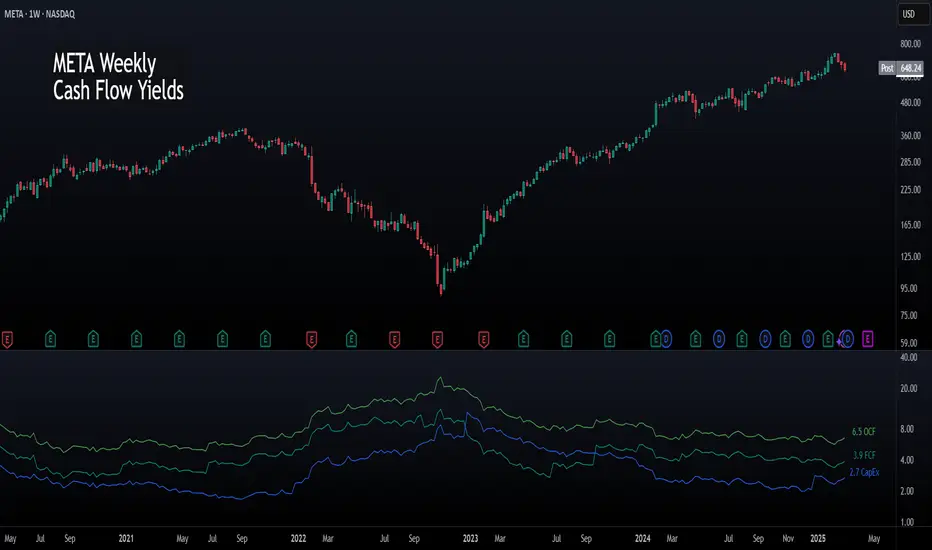
This indicator offers a straightforward way to visualize a company’s cash flow metrics—Free Cash Flow (FCF), Operating Cash Flow (OCF), and Capital Expenditures (CapEx)—as yields relative to its market capitalization. With the flexibility to switch between Trailing Twelve Months (TTM) and Quarterly data, it’s perfect for spotting financial efficiency trends at a glance. Values are plotted as dynamic lines with smart color coding and labeled for clarity.
Features:
To use it, add it to your chart and toggle between TTM or Quarterly to see trends. FCF should roughly equal OCF minus CapEx. Adjust your view to focus on companies with strong FCF yields for potential opportunities.
This indicator is freely available and open-source on TradingView for everyone to use. Enjoy!
This indicator offers a straightforward way to visualize a company’s cash flow metrics—Free Cash Flow (FCF), Operating Cash Flow (OCF), and Capital Expenditures (CapEx)—as yields relative to its market capitalization. With the flexibility to switch between Trailing Twelve Months (TTM) and Quarterly data, it’s perfect for spotting financial efficiency trends at a glance. Values are plotted as dynamic lines with smart color coding and labeled for clarity.
Features:
- TTM & Quarterly Data: Toggle between financial periods to suit your analysis.
- Color-Coded Lines: Green for positive OCF, teal for positive FCF, and blue for CapEx. Red and maroon kick in when values turn negative.
- Yield Perspective: See FCF, OCF, and CapEx as percentages of market cap, making it easy to compare cash flow strength across companies.
- Clear Labels: The latest values pop up on the chart, positioned to the right of the last bar.
- Simple & Intuitive: No clutter - just clean lines and numbers to help you focus on what matters.
To use it, add it to your chart and toggle between TTM or Quarterly to see trends. FCF should roughly equal OCF minus CapEx. Adjust your view to focus on companies with strong FCF yields for potential opportunities.
This indicator is freely available and open-source on TradingView for everyone to use. Enjoy!
Notes de version
Minor formatting updatesNotes de version
Minor formatting updateScript open-source
Dans l'esprit TradingView, le créateur de ce script l'a rendu open source afin que les traders puissent examiner et vérifier ses fonctionnalités. Bravo à l'auteur! Bien que vous puissiez l'utiliser gratuitement, n'oubliez pas que la republication du code est soumise à nos Règles.
Clause de non-responsabilité
Les informations et publications ne sont pas destinées à être, et ne constituent pas, des conseils ou recommandations financiers, d'investissement, de trading ou autres fournis ou approuvés par TradingView. Pour en savoir plus, consultez les Conditions d'utilisation.
Script open-source
Dans l'esprit TradingView, le créateur de ce script l'a rendu open source afin que les traders puissent examiner et vérifier ses fonctionnalités. Bravo à l'auteur! Bien que vous puissiez l'utiliser gratuitement, n'oubliez pas que la republication du code est soumise à nos Règles.
Clause de non-responsabilité
Les informations et publications ne sont pas destinées à être, et ne constituent pas, des conseils ou recommandations financiers, d'investissement, de trading ou autres fournis ou approuvés par TradingView. Pour en savoir plus, consultez les Conditions d'utilisation.