OPEN-SOURCE SCRIPT
Mis à jour Multi-Timeframe RSI Table

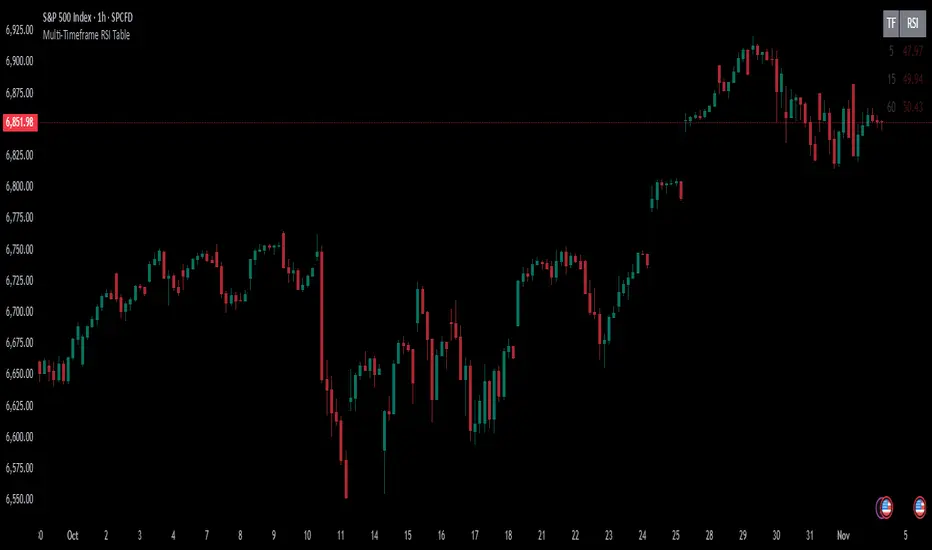
It can print RSI values of any four chosen periods in a tabular format on the chart itself. The table can be placed in any of the six positions, as required. If the RSI values are more than 40 or less than 40, these values are shown in bright Red, else it is light Red.
Notes de version
A simple indicator which shows RSI value of any four chosen time periods in a tabular format on the chart itself, thus obviating the need to toggle time frames. If these values are more than 60 or less than 40, it gets highlighted in Red, else it is light Red. The table can be placed in any of the six positions on the chart as per convenience. Script open-source
Dans l'esprit TradingView, le créateur de ce script l'a rendu open source afin que les traders puissent examiner et vérifier ses fonctionnalités. Bravo à l'auteur! Bien que vous puissiez l'utiliser gratuitement, n'oubliez pas que la republication du code est soumise à nos Règles.
Clause de non-responsabilité
Les informations et publications ne sont pas destinées à être, et ne constituent pas, des conseils ou recommandations financiers, d'investissement, de trading ou autres fournis ou approuvés par TradingView. Pour en savoir plus, consultez les Conditions d'utilisation.
Script open-source
Dans l'esprit TradingView, le créateur de ce script l'a rendu open source afin que les traders puissent examiner et vérifier ses fonctionnalités. Bravo à l'auteur! Bien que vous puissiez l'utiliser gratuitement, n'oubliez pas que la republication du code est soumise à nos Règles.
Clause de non-responsabilité
Les informations et publications ne sont pas destinées à être, et ne constituent pas, des conseils ou recommandations financiers, d'investissement, de trading ou autres fournis ou approuvés par TradingView. Pour en savoir plus, consultez les Conditions d'utilisation.