I strongly believe in cycles, so I wanted to create something that would give a visual representation of bull/bear markets and give a prediction based on the previous data. It's up to you how to decide what is a bull/bear cycle. There is no single rule for all assets because 20% drop in SP500 starts a bear market in traditional markets, while 35% drop for Bitcoin is a Tuesday. You have two options on how to decide when markets turn: either by a % change (traditional definition) or if there is no new high/low after X days. A softer version to show periods of no new highs/lows is to use the Stagnation option. Stagnation periods hava the same logic as the cycle change by X days: if there is no new high/low then we treat this period as a stagnation. The difference is that stagnation periods do not change cycle directions and do not participate in calculations.
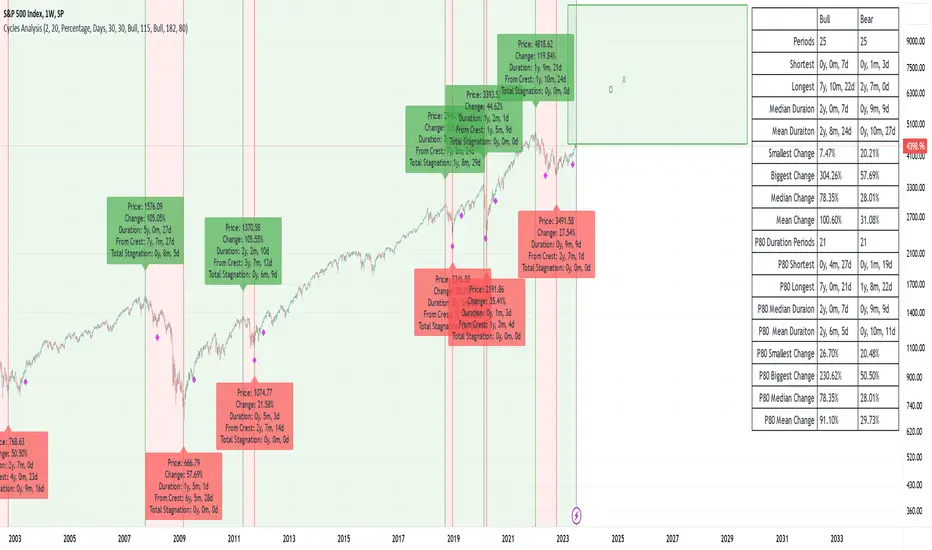
The script also draws a possible "predictions" zone where the current cycle might end up. There is no magic here, it just takes previous cycles' size to draw the possible boundaries. If you decide to use percentiles then the box area will be taken from the percentiles calculations, otherwise it will come from the full data. "x" in the predictions zone represents a target mean (average) value, "o" represents a target median value.
A few things to keep in mind:
- this script is not supposed to be used in trading. It was created for analysis. It repaints. And when I say "it repaints" - it might like repaint the last 6 months of data if a new low comes and we are in a stagnation period (aka not a financial advice).
- it doesn't work with replays as it does calculations only once on the last candle.
- you need at least 3 periods to be able to calculate percentiles. And after this it will remove at least 1 period on each side. Which means that 90 percentile will not be a real 90 percentile until you have enough periods for it to be (20 in this specific case).
- it assumes that a year = 360 days, and a month = 30 days. So the duration presentation might not be exact, until you move to the day level.
- I had macro analysis in mind when I created the script, but nothing stops you from using it in a 1m time frame for BTC. Just change the time duration presentation.
- the last period is not finished, so it doesn't participate in calculations.
Notes de version
Changes in the new version:- changed the indicator to work with replays and real time
- added decimals to % direction change
- fixed an exception when there are 0 periods
- separate percent change for bull and bear markets
- added ability to calculate duration periods in Days or Candles
- added minimum period duration
Notes de version
V2.1: Updated PineScript to V6Script open-source
Dans l'esprit TradingView, le créateur de ce script l'a rendu open source afin que les traders puissent examiner et vérifier ses fonctionnalités. Bravo à l'auteur! Bien que vous puissiez l'utiliser gratuitement, n'oubliez pas que la republication du code est soumise à nos Règles.
Clause de non-responsabilité
Les informations et publications ne sont pas destinées à être, et ne constituent pas, des conseils ou recommandations financiers, d'investissement, de trading ou autres fournis ou approuvés par TradingView. Pour en savoir plus, consultez les Conditions d'utilisation.
Script open-source
Dans l'esprit TradingView, le créateur de ce script l'a rendu open source afin que les traders puissent examiner et vérifier ses fonctionnalités. Bravo à l'auteur! Bien que vous puissiez l'utiliser gratuitement, n'oubliez pas que la republication du code est soumise à nos Règles.
Clause de non-responsabilité
Les informations et publications ne sont pas destinées à être, et ne constituent pas, des conseils ou recommandations financiers, d'investissement, de trading ou autres fournis ou approuvés par TradingView. Pour en savoir plus, consultez les Conditions d'utilisation.