PROTECTED SOURCE SCRIPT
Mis à jour Daily Engulfing Pattern Detector
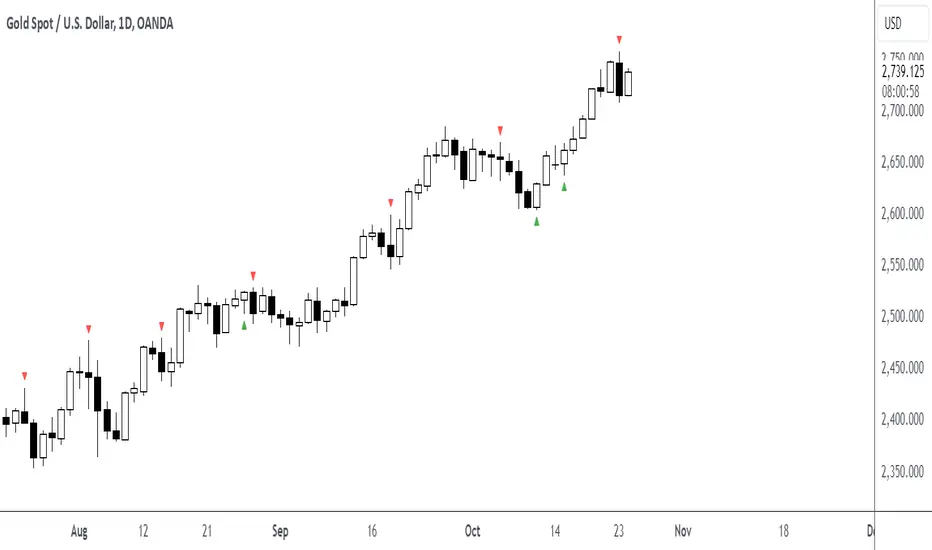
This indicator identifies bullish and bearish engulfing patterns on daily timeframes.
A bullish engulfing pattern occurs when a green candle completely engulfs the previous red candle,
taking out its low and closing above both its open and close prices. This suggests a potential trend reversal from bearish to bullish.
A bearish engulfing pattern occurs when a red candle completely engulfs the previous green candle,
taking out its high and closing below both its open and close prices. This suggests a potential trend reversal from bullish to bearish.
Features:
- Works on daily timeframe by default (customizable)
- Displays visual markers: green triangles for bullish patterns, red triangles for bearish patterns
- Includes built-in alerts for both pattern types
Set up alerts by right-clicking the indicator and selecting "Create Alert"
Notes de version
This indicator identifies bullish and bearish engulfing patterns on daily timeframes.A bullish engulfing pattern occurs when a green candle completely engulfs the previous red candle,
taking out its low and closing above both its open and close prices. This suggests a potential trend reversal from bearish to bullish.
A bearish engulfing pattern occurs when a red candle completely engulfs the previous green candle,
taking out its high and closing below both its open and close prices. This suggests a potential trend reversal from bullish to bearish.
Features:
- Works on daily timeframe by default (customizable)
- Displays visual markers: green triangles for bullish patterns, red triangles for bearish patterns
- Includes built-in alerts for both pattern types
Set up alerts by right-clicking the indicator and selecting "Create Alert"
Script protégé
Ce script est publié en source fermée. Cependant, vous pouvez l'utiliser librement et sans aucune restriction – pour en savoir plus, cliquez ici.
Clause de non-responsabilité
Les informations et publications ne sont pas destinées à être, et ne constituent pas, des conseils ou recommandations financiers, d'investissement, de trading ou autres fournis ou approuvés par TradingView. Pour en savoir plus, consultez les Conditions d'utilisation.