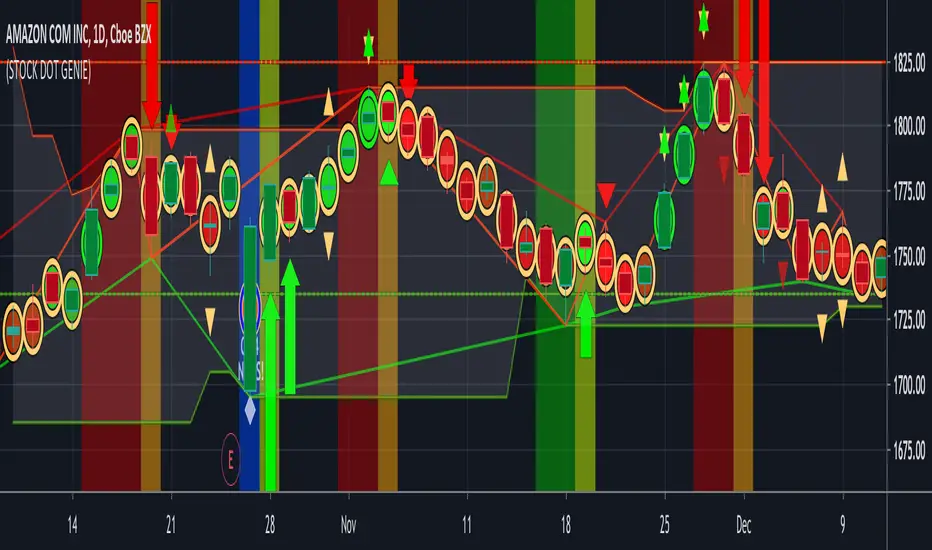
(6) Stock Dot Genie VS-369

StockDotGenie enables new and novice traders to jumpstart their trading expertise by utilizing a simple to use Technical Analysis system. SDG distills that information into a single DOT allowing you to quickly and easily determine, through simple visual cues, what your stock's short term price trend is likely to be. SDG excels at determining and flagging turning points as prices approach support or resistance. These are the areas where stocks make dramatic advancements or change directions. This makes SDG a valuable trading tool for every trader, in every timeframe.
STOCK DOT GENIE takes a different approach to technical analysis. Todays markets are much more volatile. There are many reasons for this, but the primary ones are: 1) the instantaneous availability of information over the internet, 2) Traders instantaneous ability to execute trades, again because of the internet, 3) Institutional Flash trading automatically executing thousands of micro trades per second based on algorithms, 4) Market manipulation by institutions (No I am not paranoid, it’s real). This makes the most recent days price and volume action, the most critical to making accurate short and medium term trading decisions.
Trading decisions have a much higher probability of being correct when made at support and resistance levels. When your equity is approaching or at one of these levels a background flag is activated. The DOT in Stock Dot Genie is a simple and intuitive indicator. The primary calculation is produced by determining the relative position of the center point of the last two trading days. The is a very short term, weighted center of gravity calculation. If todays dot calculation has a higher value than the calculation of the prior dot's weighted data, the current dot is painted green. If it has a smaller value it is painted red. Green indicates buy or remain in a trade. Red indicates sell or remain short in a trade. The indicator is simple, but hundreds of lines of code are utilized producing the initial indicator and a large number of exception test that override the primary indicator. These exception indicators can all be turned on or off in the input options form of the program. They are designed to reintroduce the advantages of moving averages by keeping you in a trade when the primary indicator may be telling to exit.
The benefits: All Moving Average Cross Over Indicators have a little to a lot of lag or signal delay. This lag plays an important role in keeping you in trades that have some level of volatility or the days price action moving against the controlling trend. This advantage of moving averages is also a detriment to your overall profits because this same lag delays your entry and exit signals by one to three days causing a dramatic reduction in the profit potential of moving average cross-over trading systems, no matter how sophisticated the moving average filter calculation may be. STOCK DOT GENIE gets you into a trade on the day the trend has changed. Just a important, when down days occur within an uptrend, SDG will analyze all of the relevant data to the current situation and assist you in the decision to stay in the trade or exit it.
Access this Genie indicator for your Tradingview account, through our web site. (Links Below) This will provide you with additional educational information and reference articles, videos, input and setting options and trading strategies this indicator excels in.
Script sur invitation seulement
Seuls les utilisateurs approuvés par l'auteur peuvent accéder à ce script. Vous devrez demander et obtenir l'autorisation pour l'utiliser. Celle-ci est généralement accordée après paiement. Pour plus de détails, suivez les instructions de l'auteur ci-dessous ou contactez directement StockSwinger.
TradingView ne recommande PAS d'acheter ou d'utiliser un script à moins que vous ne fassiez entièrement confiance à son auteur et que vous compreniez son fonctionnement. Vous pouvez également trouver des alternatives gratuites et open source dans nos scripts communautaires.
Instructions de l'auteur
Clause de non-responsabilité
Script sur invitation seulement
Seuls les utilisateurs approuvés par l'auteur peuvent accéder à ce script. Vous devrez demander et obtenir l'autorisation pour l'utiliser. Celle-ci est généralement accordée après paiement. Pour plus de détails, suivez les instructions de l'auteur ci-dessous ou contactez directement StockSwinger.
TradingView ne recommande PAS d'acheter ou d'utiliser un script à moins que vous ne fassiez entièrement confiance à son auteur et que vous compreniez son fonctionnement. Vous pouvez également trouver des alternatives gratuites et open source dans nos scripts communautaires.