OPEN-SOURCE SCRIPT
Combo Backtest 123 Reversal & Qstick Indicator
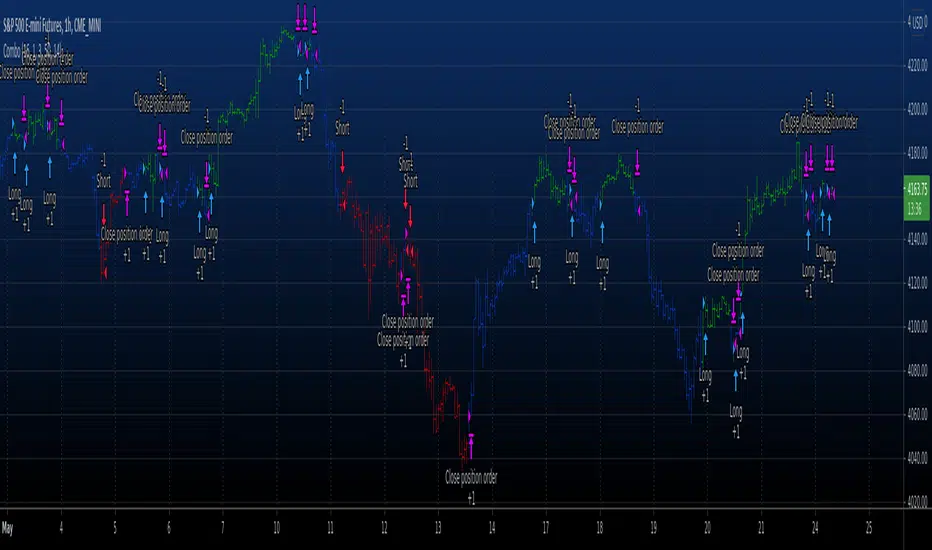
This is combo strategies for get a cumulative signal.
First strategy
This System was created from the Book "How I Tripled My Money In The
Futures Market" by Ulf Jensen, Page 183. This is reverse type of strategies.
The strategy buys at market, if close price is higher than the previous close
during 2 days and the meaning of 9-days Stochastic Slow Oscillator is lower than 50.
The strategy sells at market, if close price is lower than the previous close price
during 2 days and the meaning of 9-days Stochastic Fast Oscillator is higher than 50.
Second strategy
A technical indicator developed by Tushar Chande to numerically identify
trends in candlestick charting. It is calculated by taking an 'n' period
moving average of the difference between the open and closing prices. A
Qstick value greater than zero means that the majority of the last 'n' days
have been up, indicating that buying pressure has been increasing.
Transaction signals come from when the Qstick indicator crosses through the
zero line. Crossing above zero is used as the entry signal because it is indicating
that buying pressure is increasing, while sell signals come from the indicator
crossing down through zero. In addition, an 'n' period moving average of the Qstick
values can be drawn to act as a signal line. Transaction signals are then generated
when the Qstick value crosses through the trigger line.
WARNING:
- For purpose educate only
- This script to change bars colors.
Script open-source
Dans l'esprit TradingView, le créateur de ce script l'a rendu open source afin que les traders puissent examiner et vérifier ses fonctionnalités. Bravo à l'auteur! Bien que vous puissiez l'utiliser gratuitement, n'oubliez pas que la republication du code est soumise à nos Règles.
Clause de non-responsabilité
Les informations et publications ne sont pas destinées à être, et ne constituent pas, des conseils ou recommandations financiers, d'investissement, de trading ou autres fournis ou approuvés par TradingView. Pour en savoir plus, consultez les Conditions d'utilisation.