PROTECTED SOURCE SCRIPT
Yield curve indicator trial
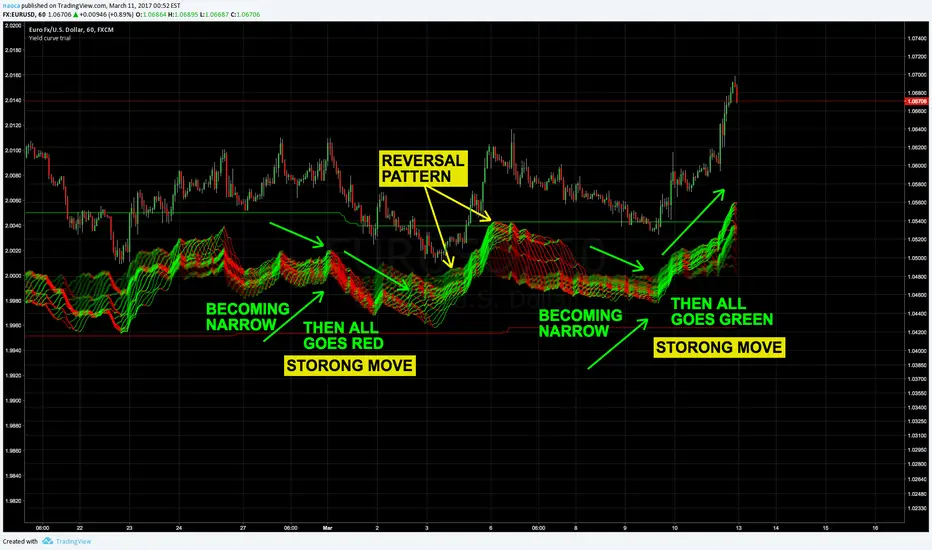
This indicator shows the multiple time frame yield curves of chart.
It’s useful to understand how much good or bad is the performance for short-term & long-term traders.
Near side of lines indicates longer term yield.
And far side of lines indicates shorter term of yield.
While it’s ascending, its color is green & if not it will be red.
- - - - - - - - - - - - - - - - - - - - - - - - - - - - - -
This is trial version. You can check how it works on any chart!
* Data before March. 17th, 2017 can be shown.
More information:
tradeindicator.tumblr.com/post/158257399947/yield-curve-indicator
tradeindicator.tumblr.com/
Script protégé
Ce script est publié en source fermée. Cependant, vous pouvez l'utiliser librement et sans aucune restriction – pour en savoir plus, cliquez ici.
Clause de non-responsabilité
Les informations et publications ne sont pas destinées à être, et ne constituent pas, des conseils ou recommandations financiers, d'investissement, de trading ou autres fournis ou approuvés par TradingView. Pour en savoir plus, consultez les Conditions d'utilisation.