INVITE-ONLY SCRIPT
Naked Put - Growth Indicator
Mis à jour
DISCLAIMER: Do NOT follow this strategy unless you are aware of the risks of selling naked options.
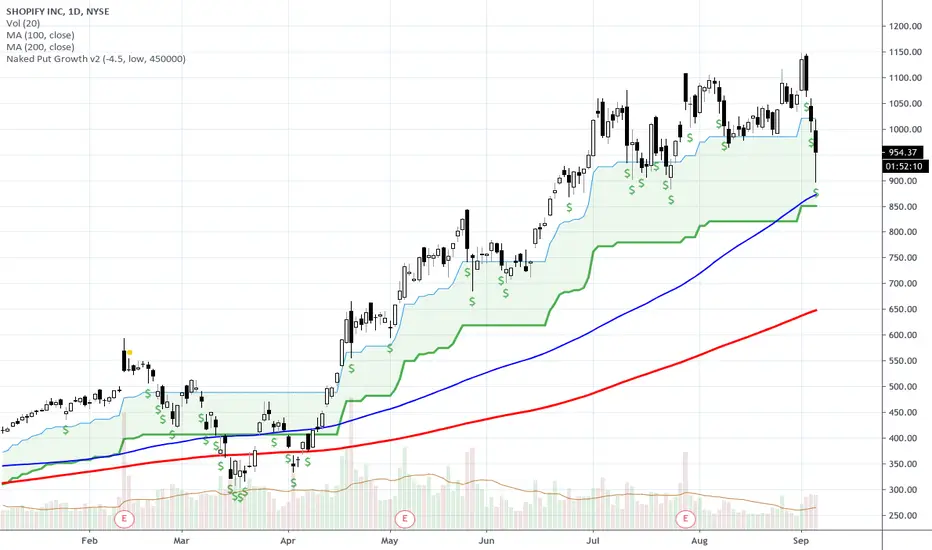
1) I have identified 20 companies with 30%+ YoY revenue growth (using the most recent quarter) and minimum "average trading volume": ZEN, TEAM, BABA, SHOP, RNG, SPLK, NFLX, FB, WIX, SQ, MULE, WDAY, MU, HUBS, ABT, LOGM, NEWR, NVDA, MELI, AMZN, NOW. I like companies that fit this criteria because 30%+ revenue growth means their revenue double every ~2.5 year and their "market cap" is based on their revenue.
2) When you see a green "$" icon above a candle on a DAILY chart, that means it's a good time to "sell naked puts" using the solid green line as the approximate "strike price". I prefer 3-9 months until expiration and "stagger" my expirations so it's not possible for everything to be put to me all at once.
3) I use a "minimum premium" and "max contracts" that I sell that suits my risk tolerance, you will need to calculate your own contract size based on your risk tolerance.
*NOTE: This only works on a DAILY chart, and only works on the companies identified above -- if you are using intraday, weekly or monthly, the "$" signs do NOT appear.
RISK NOTE: I do NOT sell any naked puts unless I am 100% ready to own the shares AND have enough capital in my account if they are put to me, you should do the same. Don't follow this strategy unless you are prepared to OWN shares at expiration.
Notes de version
added a few tweaksNotes de version
Changed some defaults and fix a few small bugsNotes de version
Jul12 2018: Fixed a few issues with the calculations..Notes de version
Updated version of the naked put indicator. 1. I don't hardcode any tickers anymore, got too many questions about that.
2. There is a blue line (10% pullback) & green line shaded area that draws the 10-25% pullback zone to sell premium which price action is in that zone.
3. The green line is the strike price where you sell the options.
Script sur invitation seulement
L'accès à ce script est limité aux utilisateurs autorisés par l'auteur et nécessite généralement un paiement. Vous pouvez l'ajouter à vos favoris, mais vous ne pourrez l'utiliser qu'après avoir demandé et obtenu l'autorisation de son auteur. Contactez MattDeLong pour plus d'informations, ou suivez les instructions de l'auteur ci-dessous.
TradingView ne suggère pas de payer pour un script et de l'utiliser à moins que vous ne fassiez confiance à 100% à son auteur et que vous compreniez comment le script fonctionne. Dans de nombreux cas, vous pouvez trouver une bonne alternative open-source gratuite dans nos Scripts communautaires.
Instructions de l'auteur
″
Vous voulez utiliser ce script sur un graphique ?
Avertissement: veuillez lire avant de demander l'accès.
Clause de non-responsabilité
Les informations et les publications ne sont pas destinées à être, et ne constituent pas, des conseils ou des recommandations en matière de finance, d'investissement, de trading ou d'autres types de conseils fournis ou approuvés par TradingView. Pour en savoir plus, consultez les Conditions d'utilisation.