PROTECTED SOURCE SCRIPT
Mis à jour OBV Correlation [Fournier-Eaton]
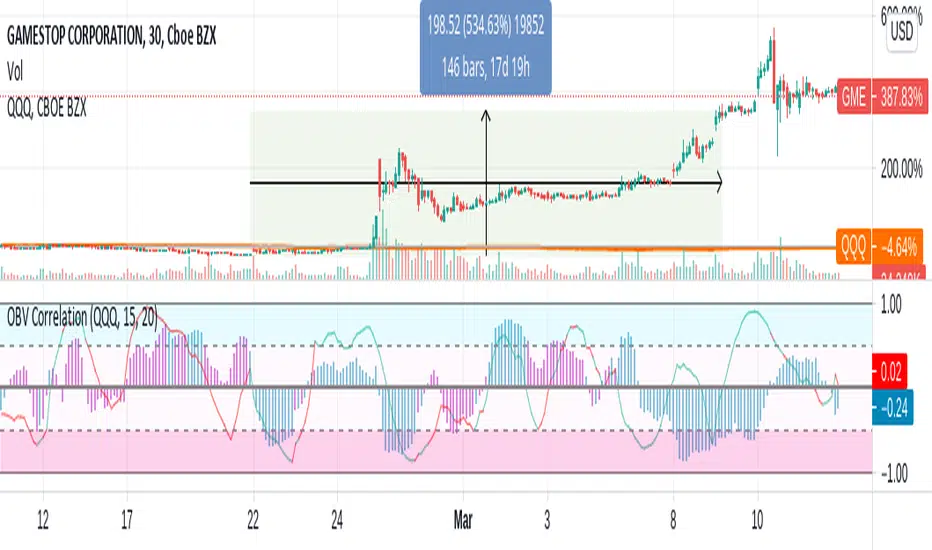
This is the On Balance Volume Correlation (And Price Correlation) Indicator. Directions of each has been encoded with color.
This Indicator is one of a series of scripts which I hope will aid in volume analysis.
If you find this at all useful, I'd love to hear from you.
Bradford Fournier-Eaton, PhD
This Indicator is one of a series of scripts which I hope will aid in volume analysis.
- The primary component is the histogram plot which represents the correlation between the direction of obv of your current equity and your chosen reference equity.
- I have included the direction of OBV for your currently plotted equity encoded as color. (Thus you know that if the plot is negative and blue, that the correlation is negative but the OBV for your current equity is increasing.)
- Furthermore, I included a supplementary price correlation line for the given equities. This line has had price direction encoded as color for quick reference.
- Thus as a quick example: if you see a blue negative histogram and an accompanying red positive line you know that: 1. obv is increasing and anti-correlated with your reference equity and the price is decreasing and positively correlated with your reference equity. A lot of information encoded in one plot.
If you find this at all useful, I'd love to hear from you.
Bradford Fournier-Eaton, PhD
Notes de version
- UPDATE: obv length corrected to be independent of correlation length(s).
Script protégé
Ce script est publié en source fermée. Cependant, vous pouvez l'utiliser librement et sans aucune restriction – pour en savoir plus, cliquez ici.
Clause de non-responsabilité
Les informations et publications ne sont pas destinées à être, et ne constituent pas, des conseils ou recommandations financiers, d'investissement, de trading ou autres fournis ou approuvés par TradingView. Pour en savoir plus, consultez les Conditions d'utilisation.