PROTECTED SOURCE SCRIPT
Complete Pivot Ranges

I forgot what book I read this from. But basically a successful trader would create a range using the open/high/low/close of the previous day, and the high/low of the previous day.
I created the indicator from the book, but also added a few other pivots to it. You can hide the ones you don't need in settings.
He also mentioned that the resistance of this area is a lot like a samurai and armour, and that if price falls through the pivot, it will fall faster. Just like a sword that penetrates armour will go straight through your body.
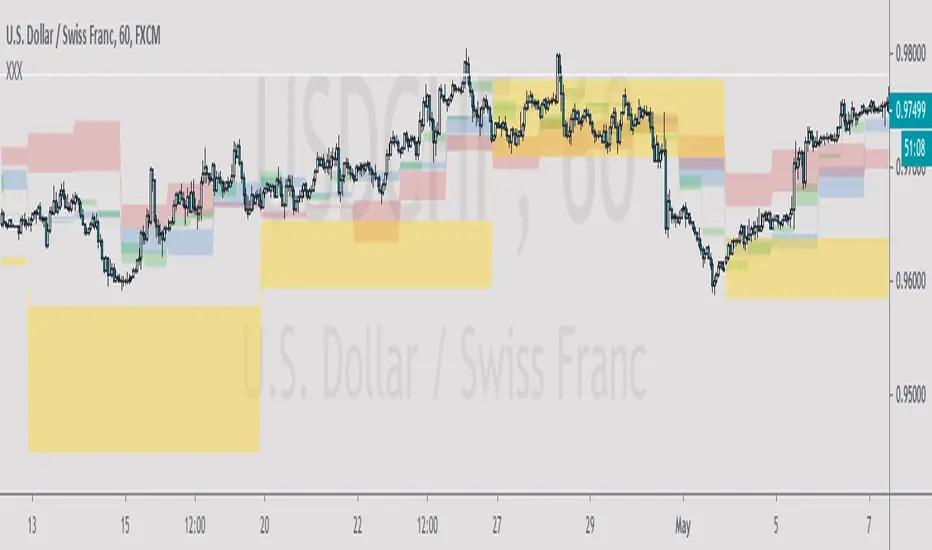
Green = half day pivot. :: I've noticed price can be rejected from these areas against the trend during the day
Blue = daily pivot. :: My favourite. You can see how the trend is going by checking how it steps. There is good value in putting orders on in this range, especially when price is touching a 50 ema on the 15 min chart.
Red = 5 day rolling pivot :: collects the open/high/low/close of the last 5 days and makes a daily range with them. Best used with 50ema on the hour chart. The book used a 3 day rolling pivot but I find this more useful.
Yellow = 5 week rolling pivot :: like the red rolling pivot above but using the last 5 weeks. Best on 4 hour chart.
As with all indicators see if it can give you value and if it's right for your trading.
Cheers
Script protégé
Ce script est publié en source fermée. Cependant, vous pouvez l'utiliser librement et sans aucune restriction – pour en savoir plus, cliquez ici.
Clause de non-responsabilité
Les informations et publications ne sont pas destinées à être, et ne constituent pas, des conseils ou recommandations financiers, d'investissement, de trading ou autres fournis ou approuvés par TradingView. Pour en savoir plus, consultez les Conditions d'utilisation.