PROTECTED SOURCE SCRIPT
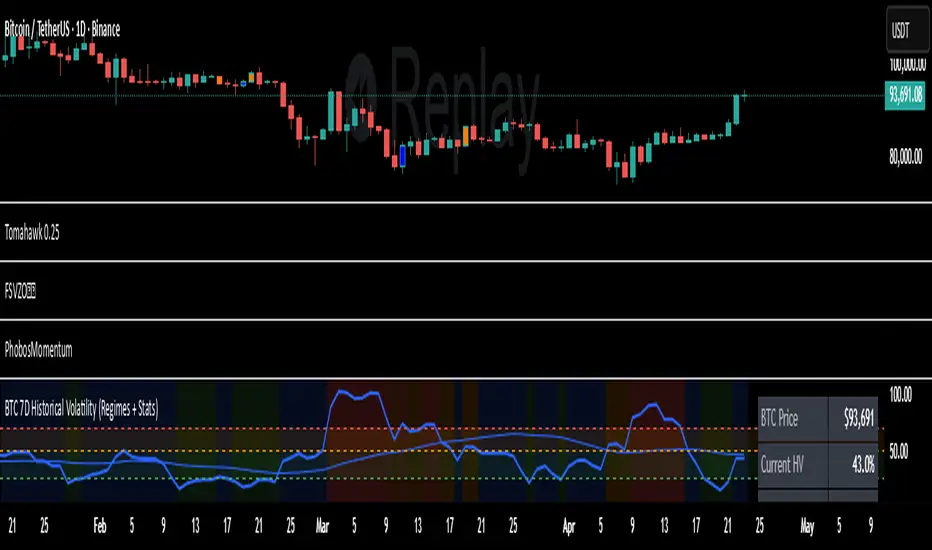
7D Historical Volatility (Regimes + Stats) - Chrrizzy
Here’s what that indicator does—at a glance:
### Core idea
It computes **7-day Historical Volatility (HV)** from **daily** log returns (annualized), then shows:
* the **HV line** and its **30-day average**,
* colored **volatility regimes** (Low / Normal / High / Extreme) with thresholds you set,
* a compact **status panel** (top-right, nudged left) with current stats and time-in-zone.
### Calculations
* **HV (7D)**: `stdev(log(close/close[1]), 7) * sqrt(365) * 100`, always from **daily data** via `request.security`, so it’s consistent on any chart timeframe.
* **Regimes** (defaults):
Low < 25% • Normal 25–50% • High 50–70% • Extreme > 70% (all editable).
* **30-day avg**: SMA of HV.
* **Time in zone (% over window)**: SMA of boolean flags (e.g., in Low=1 else 0) over `statsWin` days (default 300).
* **Rolling median HV**: 50th percentile over `statsWin`.
### What you see on the chart
* **HV line** (bold) + **30-day HV** (lighter).
* **Horizontal dashed lines** at your regime thresholds.
* **Background shading** that changes with the current regime (green/blue/orange/red).
### Panel (top-right)
Shows:
* BTC Price (daily close)
* Current HV
* 30-day Avg HV
* Median HV (over window)
* Current **Regime**
* A two-line summary: **% of time spent** in Low / Normal / High / Extreme over the chosen window.
The panel is shifted slightly left using a hidden spacer column; tweak the **“Panel right padding (chars)”** input to move it.
### Alerts (ready to use)
* **HV crossed up Low**
* **HV crossed down Low**
* **HV crossed up High**
* **HV crossed up Extreme**
### Inputs you can tune
* `HV Lookback (days)` (default 7)
* `Average HV (days)` (default 30)
* Thresholds: Low/High/Extreme
* `Stats Window (days)` (default 300)
* Panel padding, toggle table/zones on/off.
### How to use it
* **Context**: quickly see if BTC is in **compressed** (Low) or **stressed** (High/Extreme) volatility.
* **Regime cross alerts**: get notified when volatility **expands** from Low (potential breakout conditions) or pushes into High/Extreme (risk increases).
* **Stats/median**: compare today’s HV to its typical level over your lookback window.
If you want, I can add an **HV percentile rank** (e.g., “Current HV is at the 38th percentile over 300d”) or mirror the **low-vol breakout signal** from Script A into this panel.
Script protégé
Ce script est publié en source fermée. Cependant, vous pouvez l'utiliser librement et sans aucune restriction – pour en savoir plus, cliquez ici.
Clause de non-responsabilité
Les informations et publications ne sont pas destinées à être, et ne constituent pas, des conseils ou recommandations financiers, d'investissement, de trading ou autres fournis ou approuvés par TradingView. Pour en savoir plus, consultez les Conditions d'utilisation.